UNLOCK
Guide to GTM Fit
Introduction
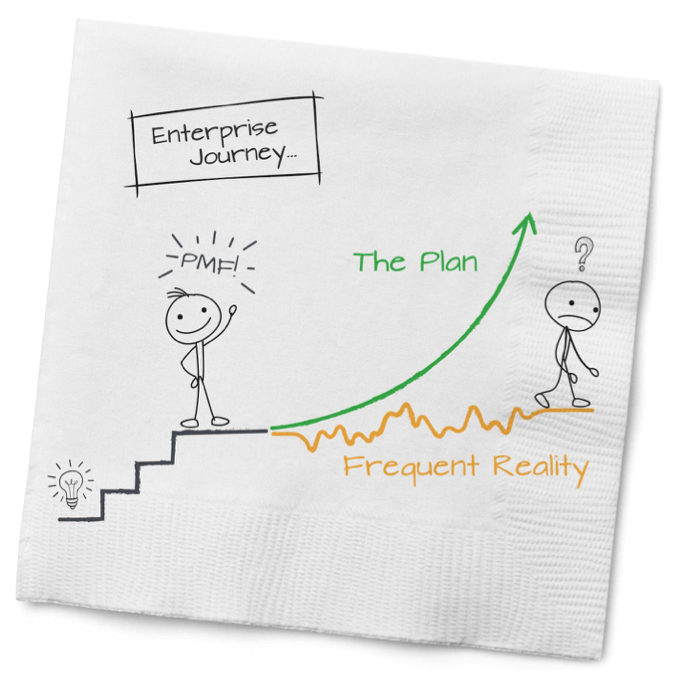
When many enterprise startups get to PMF, they feel they’re ready to take off. “We have product-market fit! Let’s grow! Hire sales! Invest in marketing! Spend!”
The unfortunate frequent reality kicks in. Instead of sales taking off, sales just bump along. The number of new customers grows sporadically, painfully disproportionate to the rapid increase in sales and marketing.
Many enterprise startups get to PMF but don’t achieve growth and acceleration.
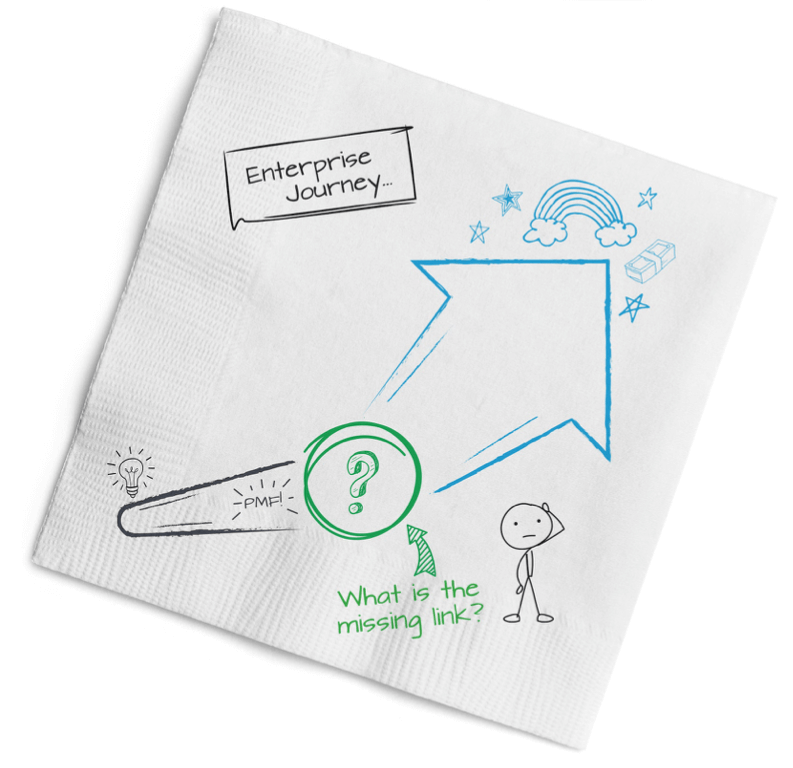
Why? Because there’s a “missing link” between PMF and accelerated growth for the enterprise startup journey.
The missing link is something we call Go-To-Market Fit, or GTM Fit.
UNLOCK is a GTM Fit Guide
UNLOCK is a comprehensive GTM Fit Guide based on Chapter 3 (Go-To-Market Fit) from our first book, Building the Enterprise Startup: The Company Journey.
In The Company Journey, we coined the term “Go-to-Market Fit.” The response to the book was incredible, and notes from readers showed us we had many questions left to answer. Many responded: “We appreciate the insight of GTM Fit… but how do we find it?” So, we decided to mine the experiences of our portfolio companies to share a repeatable “recipe” for achieving GTM Fit and unlocking growth.
Brief Overview of UNLOCK
UNLOCK outlines our 4-step path to finding GTM Fit and unlocking growth. We’ve added 100+ pages of new content, real-life examples, interviews and resources to help you find GTM Fit to unlock growth. If you’re new to the subject, we recommend reading the sections in order. However, if you’re looking to dive deep into some sections and skim others, you can easily skip around using the table of contents on the left.
Our approach was to provide as many real-world examples and applications as possible. The GTM Tip, Challenge, and Common Mistake boxes go in depth on issues you’re likely to encounter on the path to GTM Fit. We’ve also provided many diagrams and links to downloadable resources to help you on your journey. The idea is that you can dive into as much detail or little as you want.
With that in mind, here’s a short outline of the modules that lie ahead:
In GTM Fit Basics, we explain what GTM Fit is, when to look for it, and why it matters for unlocking growth.
Next, we dive into the 4 steps to unlock growth. We see GTM Fit as the transition from paddling to surfing. Paddling is painful. Surfers expend a tremendous amount of energy paddling for relatively little progress. Without GTM Fit, companies burn a tremendous amount of cash for minimal growth. Once you find GTM Fit, you’re no longer paddling for your life. It’s pure momentum.
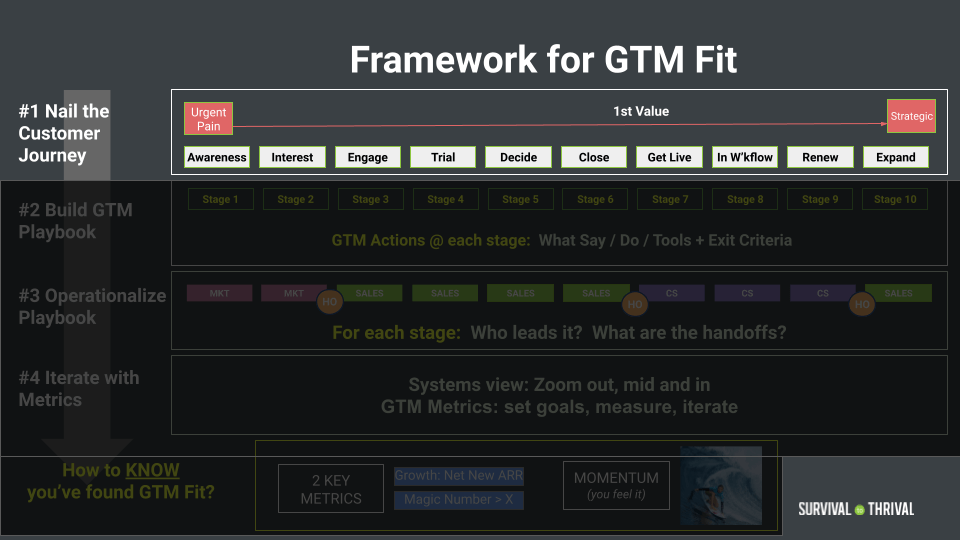
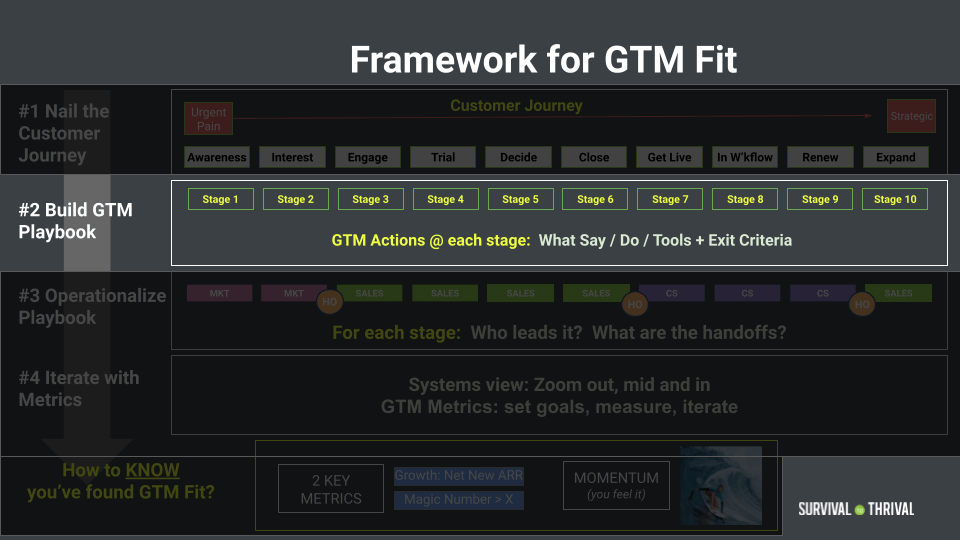
Our 4-step path is designed to take you from paddling to surfing:
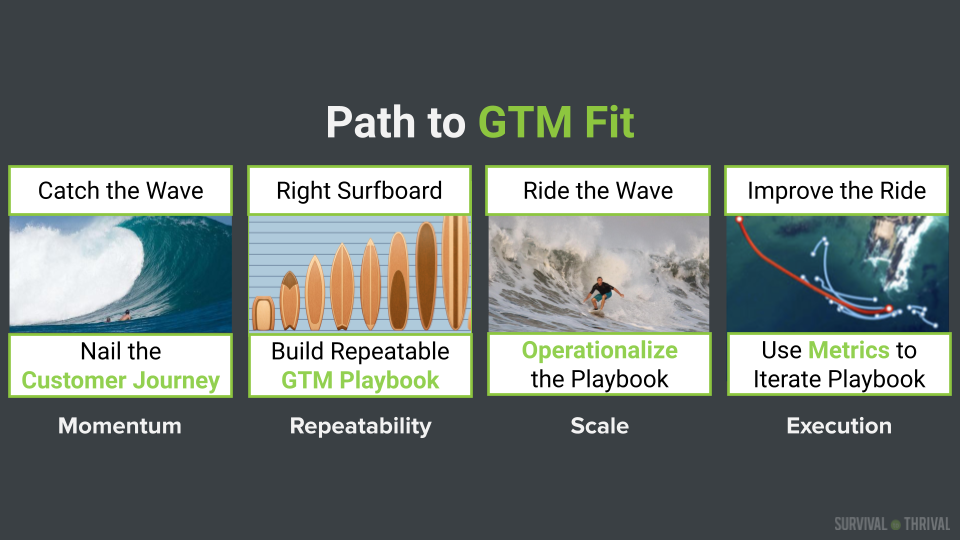
Step 1 is Catch the Wave: Nail Customer Journey (CJ). The CJ is the backbone of your entire Go-To-Market. Everything else is built on top of it. The CJ starts with the Urgent Pain and ends when your company becomes strategic to the customer. To find out how to win first customers, we interviewed two first customers (Barclays MD of Cyber Risk JJ Juergensen and Medallia CIO Ashwin Ballal), who illuminated the fundamental difference between the customer and the founder: risk asymmetry.
Step 2 is to Build The Right Surfboard: Your Repeatable GTM Playbook. The GTM playbook is a step-by-step, repeatable recipe to find and win deals over and over again. It becomes the blueprint for your marketing and sales teams. It becomes the bible for every new sales or marketing person to ramp. It becomes a powerful tool to align the rest of the team behind a go-to-market plan. For this section, we interviewed Zenefits CEO Jay Fulcher to dig deeper into the differences between sales-led and product-led playbooks.
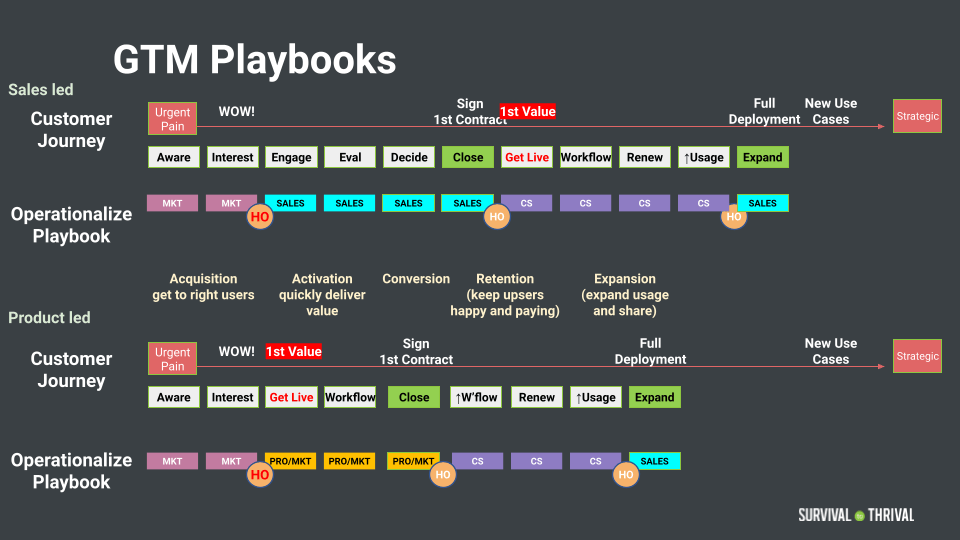
Step 3 is to Ride The Wave: Operationalize The Playbook. The GTM Playbook cuts across marketing, sales, customer success and product. It’s the most cross-functional project there is in a startup! Therefore the CEO is the only person with the visibility to see across the company — and the authority to get the whole company behind it. Moving through the stages of the GTM Playbook is like a relay race — passing the baton from one leader/team to the next. Identify which department or function takes the baton for each stage of the playbook. Like a relay race, the handoffs are where races are won or lost: the baton is either smoothly handed to the next stage, or it’s fumbled.
Step 4 is to Improve the Ride: Iterate On Your Playbook Using Metrics. We’ll explain how to understand the hierarchy of metrics and use it to diagnose and fix problems in your GTM. The key is to use the concepts of “variable zoom” and “system view.”
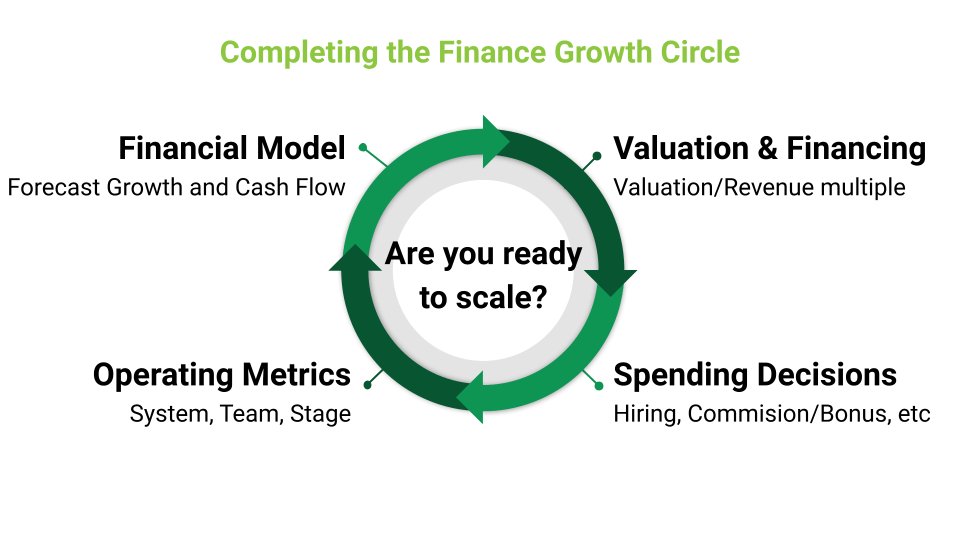
Finally, we’ll talk about your financial plan for Post-GTM Fit. After finding GTM Fit, CEOs want to rapidly scale. But investors want to know if they’ll make money. In order to secure financing and execute the growth plan, the CEO needs to make a financial plan and complete the “financial growth circle,” as shown in the diagram below. We’ll show you how to do that with just 3 metrics.
How to Send Feedback
We’d love to hear from you! UNLOCK is a living document and a work in progress, and we hope it will improve as we incorporate feedback from our readers. Please feel free to drop us a line in the feedback box or at S2T@StormVentures.com.
About Survival to Thrival
The Survival to Thrival series is a mindmeld of a three-time entrepreneur, a long-time venture capitalist, and an entrepreneur community who share their learnings and unlearnings. Our mission is to help you succeed, anticipate what is next, and most importantly, understand that you are not alone.
We — the authors — are Bob Tinker, a three-time enterprise entrepreneur, and Tae Hea Nahm (pronounced Tay-Hee Naam), a long-time venture capitalist. We spent the last 20 years on the battlefield together as an entrepreneur-investor combo team, and fortunate enough to help build two enterprise startups from zero to high growth, resulting in one acquisition and one IPO. The first, WiFi company Airespace that was bought by Cisco for $450M, and then mobile security company MobileIron that we took public in 2014.
Survival to Thrival began as a book series. Our first book, The Company Journey, is all about how to find GTM Fit and unlock growth. Our second book, Change or Be Changed, is about how to adapt and persevere when growth is hard on the team. In each episode of our podcast, we discuss key topics underpinning the book series. Our GTM Fit Guide UNLOCK is our latest collaborative project.
GTM Fit Basics
When many enterprise startups get to PMF, they feel they’re ready to take off. “We have product-market fit! Let’s grow! Hire sales! Invest in marketing! Spend!”
The unfortunate frequent reality kicks in. Instead of sales taking off, sales just bump along. The number of new customers grows sporadically, painfully disproportionate to the rapid increase in sales and marketing.
“We hired sales and invested in marketing, and the only thing that went up was our cash-burn! We’re frustrated. Our investors are antsy. What gives?”
What gives is this: PMF is sufficient to create growth and acceleration in consumer startups, but it’s not sufficient to create growth and acceleration in enterprise startups. The enterprise journey is different.
Many enterprise startups get to PMF but don’t achieve growth and acceleration.
Why? Because there’s a “missing link” between PMF and accelerated growth for the enterprise startup journey.
The missing link is something we call Go-To-Market fit, or GTM Fit. We think it’s every bit as important for enterprise startups as PMF.
Developing and achieving GTM Fit is the number one thing about building a business that enterprise startups miss. Too often, founders and early investors assume that rapid growth will immediately follow PMF. This is natural. They believe strongly in the product and the market opportunity.
PMF does not factor in how a startup found and won its customers, how repeatable its wins are, and what those wins cost. But rapid growth for an enterprise startup only comes when the company can line up PMF with a go-to-market motion that repeats and scales to find and win customers over and over again. GTM Fit does all of that. It provides early proof of your GTM motion and reveals early signs of momentum and growth.
What is GTM Fit?
So, what exactly is GTM Fit?
“This may sound simplistic, but you have GTM Fit when you have a ‘Yes’ answer to these two questions: ‘Do you feel customers pull you in? And, do you have a one-page playbook for repeatable wins?‘”
–Bob

What’s a metaphor for GTM Fit? GTM Fit is the difference between paddling and surfing. Paddling is painful. Surfers expend a tremendous amount of energy paddling for relatively little progress. Without GTM Fit, companies struggle to win deal by deal, spending lots of cash and energy. Tensions run high as growth is hard, repeatability is missing, and everyone stares at the rapidly impending zero cash date.
Once you find GTM Fit, you’re no longer paddling for your life. You’re surfing a wave with lots of leads where deals convert and repeatability is visible. For every dollar you put into sales and marketing, you get more than a dollar out. In other words, it’s pure momentum.
When to Look for GTM Fit
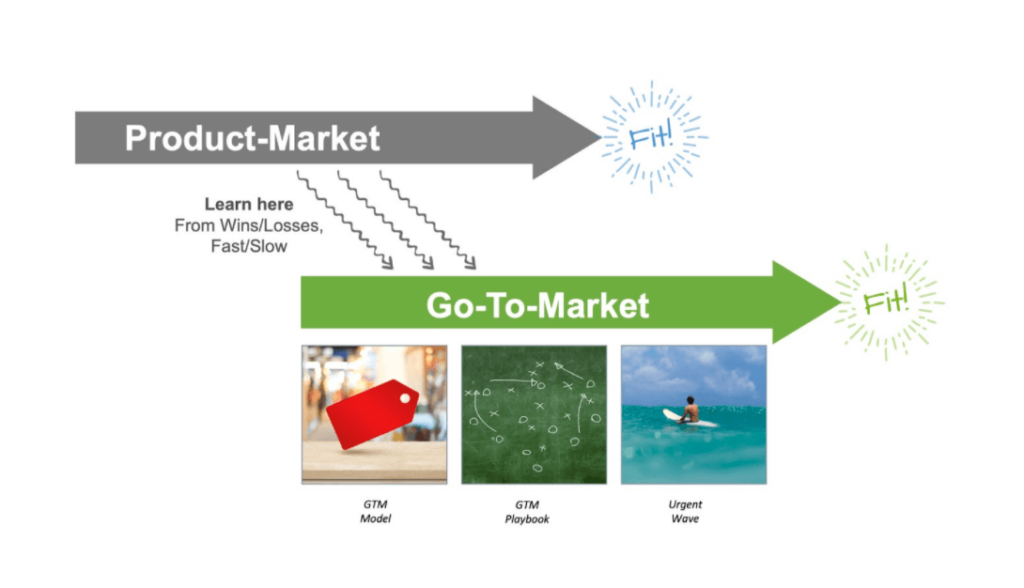
Start looking for GTM Fit midway through the search for PMF. Why? The customer interactions at the latter part of PMF provide major clues for and help inform the iterations to find GTM Fit.
In particular, pay close attention to customer behaviors during the latter half of PM Fit: what got their attention; why do they spend time with you; who commits and who doesn’t; who moves fast and slow; why did they buy and why did they not; and who actually makes the purchase decisions. The mixture of positive and negative data points are hugely valuable market signals for finding GTM Fit.
Why Does GTM Fit Matter?
Okay okay, surfing instead of paddling sounds all well and good — but do you really need GTM Fit to do that? Isn’t it enough to achieve PMF and scale up? Yes — if you want to waste a lot of time and money!
Some who believe PMF is sufficient to unlock growth will recommend that the simple answer is “hire more sales” or “invest more in marketing”—essentially spend your way to GTM Fit. That rarely works. Without urgency and a repeatable recipe to find and win deals, increasing sales and marketing spend is like throwing money against the wall.
The pressure to hit the gas on sales and marketing will be enormous, but don’t do it until you can see the repeatable GTM playbook and GTM Fit. Setting an explicit GTM Fit milestone with the board and the leadership team will help everybody manage expectations and create focus. Once you have GTM Fit and feel the momentum, then it’s time to hit the gas.
Finding GTM Fit is hard. The stakes are high. The search is stressful. It creates cultural and organizational changes, as GTM becomes as important as product. At the same time, it allows you to win customers, and that’s energizing. Seeing patterns emerge that can be repeated makes everybody in the company realize that they’re not crazy. Hiring grade-A talent becomes much easier. You pick up momentum, and it’s a blast.
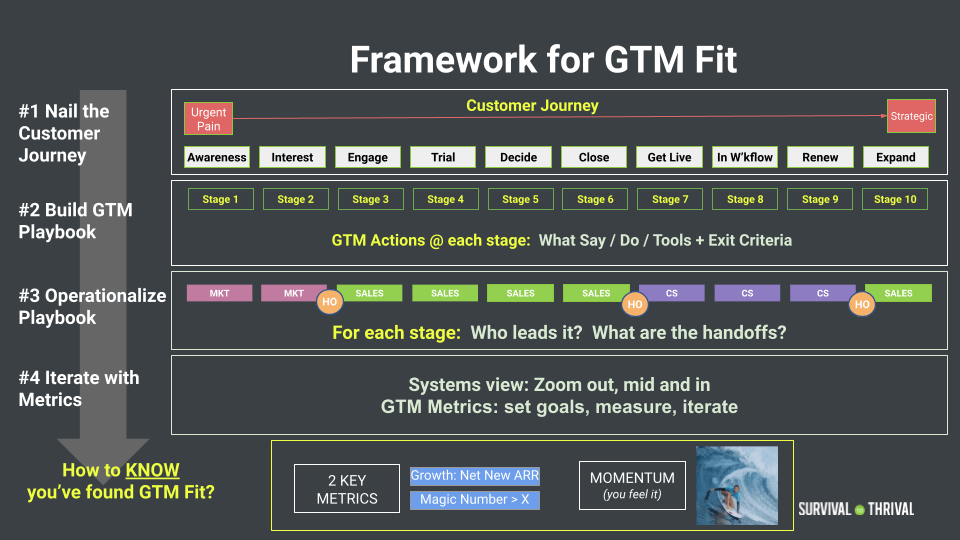
The 4 Steps to GTM Fit
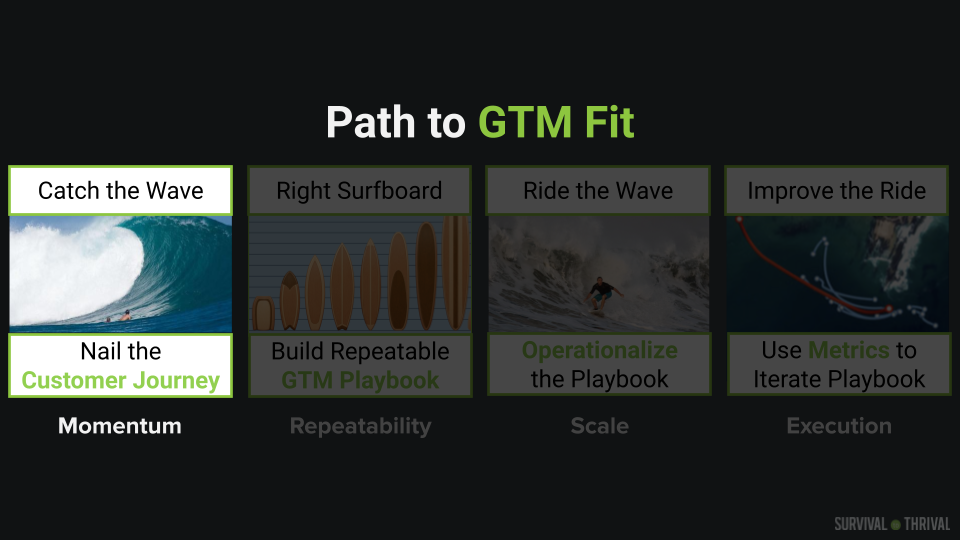
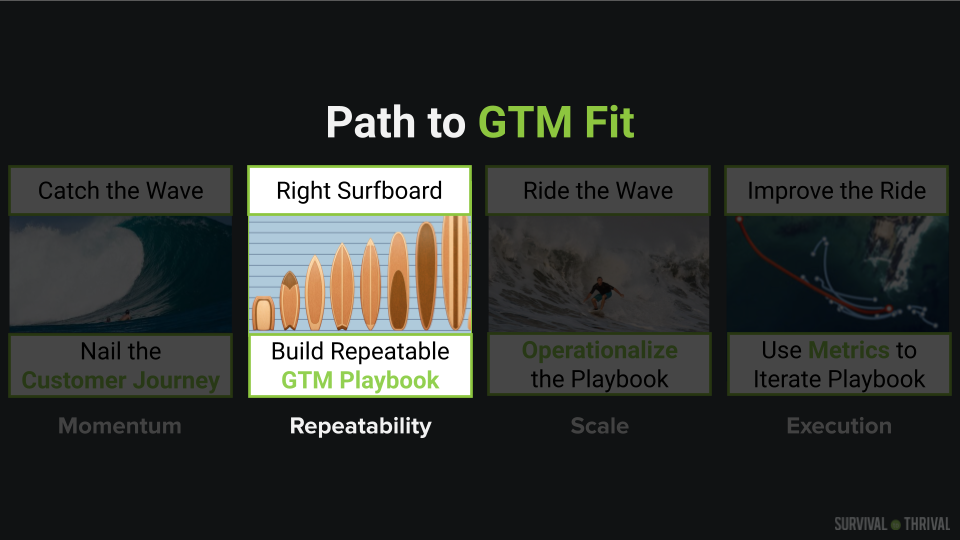
Let’s break things down. (And keep using the surfing metaphor because, well, we like it.) Finding GTM Fit is a challenge that has four parts:
- Catch the Wave: Nail the Customer Journey — and you harness lots of momentum.
- Build the Right Surfboard: Create a Repeatable GTM Playbook — and you get repeatability.
- Ride the Wave: Operationalize the Playbook — and you can scale the GTM.
- Improve the Ride: Iterate with Metrics — and you can improve GTM execution.
The four-step path to GTM fit starts with the Customer Journey (CJ), the framework for your GTM Playbook (see graphic below).
As you follow the path to GTM Fit, each step builds on the last, mapping onto what you’ve done before. When you reach the end, you’ll be able to see how everything fits together. If it sounds intimidating now, don’t worry. We’re going to take things step by step.
#1 Catch the Wave: Nail the Customer Journey
You can’t surf if you don’t catch the wave. But it’s not enough for surfers to find a wave — they need to read it, too. Is it a beach break, a reform wave, or a double-up? The structure of the wave will determine the surfer’s approach.
For the enterprise startup, finding the wave means identifying the Urgent Pain for the Ideal Customer Profile that drives customers to buy now. The wave starts with the Urgent Pain for the Ideal Customer Profile and ends when your company becomes strategic to the customer. This is especially critical for SaaS startups, since signing the contract is only the beginning of the relationship with the customer, and so much of the business is based on renewals and upsells.
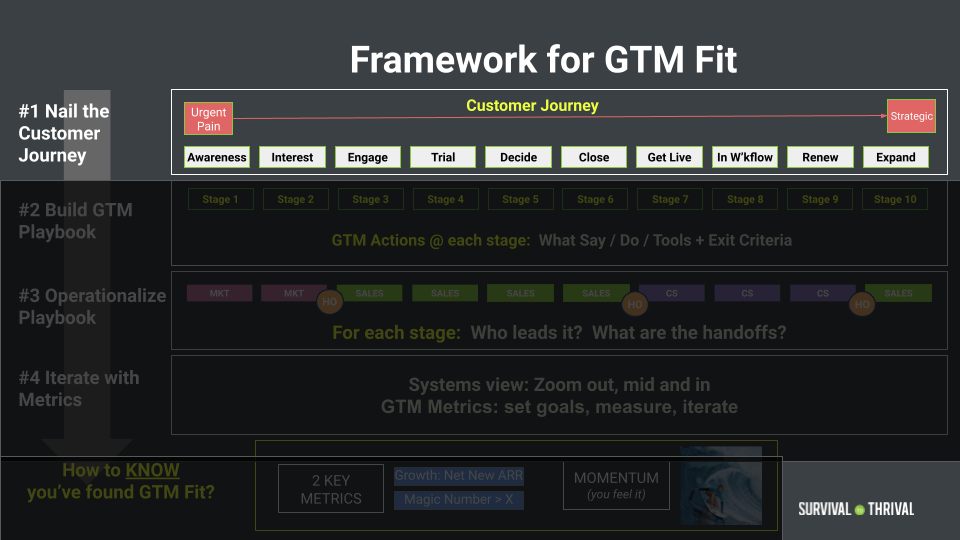
The Customer Journey (CJ) is the backbone of your entire Go-To-Market. Everything else is built on top of it. Nailing the CJ means:
- Start with the Urgent Pain
- Work out the Full CJ — Including the 7 Key Milestones
- Win first customers
- End by becoming strategic to the customer
Let’s start with the first part.
Start CJ With the Urgent Pain
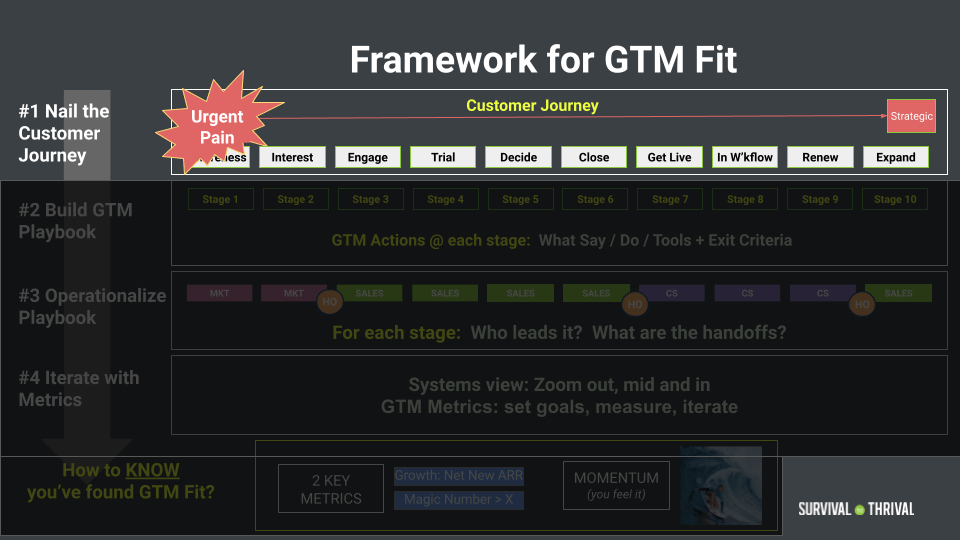
The first step of the CJ is the Urgent Pain.
Without an Urgent Pain, there is no GTM Fit. Period. Growth will be slow and painful. Why? Urgent pain drives leads. Urgent pain drives customers to engage. Urgent pain drives customers to decide to buy. Urgent pain drives customers to buy new products from new companies vs legacy vendors. But most importantly, the urgent pain answers the question:
“Why buy now, versus a year from now?”
If you can’t answer that question, you do not have urgency. It’s that simple. Without a clear urgent pain, why should the customer put their reputation on the line to buy a new product from a new company? Or maybe they do engage with you, but it’s endless educational meetings and a never-ending sales cycle. Why should they even bother to spend their valuable time engaging with you at all?
Usually, the urgent “why now” problem won’t feel like a sexy way to disrupt the status quo. But finding this pain is important, because it creates the entry for the enterprise startup, and motivation for immediate customer action. And by addressing an urgent pain for your Ideal Customer Profile (ICP), you can methodically find and catch the wave of momentum.
So, how do you find the urgent pain that drives GTM Fit? By being open-minded and searching systematically. Some find the urgent pain by luck or magical founder intuition, but some companies find the urgent pain through a systematic search process:
- Be open-minded and cast a wider net — even it feels like heresy
- Document all the data — even it feels irrelevant at the time
- Find the patterns and hotspots
Be Open-Minded and Cast a Wider Net — Even if it Feels like Heresy
Imagine the enterprise startup surfer in the water. The startup paddled very hard to the spot where they think the urgent pain should be. But the urgent pain might not be there. It might be a little to the right. Or a little farther in front. Or a few yards behind. Regardless, the urgent pain is probably not where they thought it was when they started the company. It needs to be searched for — systematically. And that’s hard. Because finding the urgent pain almost always requires the startup to commit “founder heresy.”
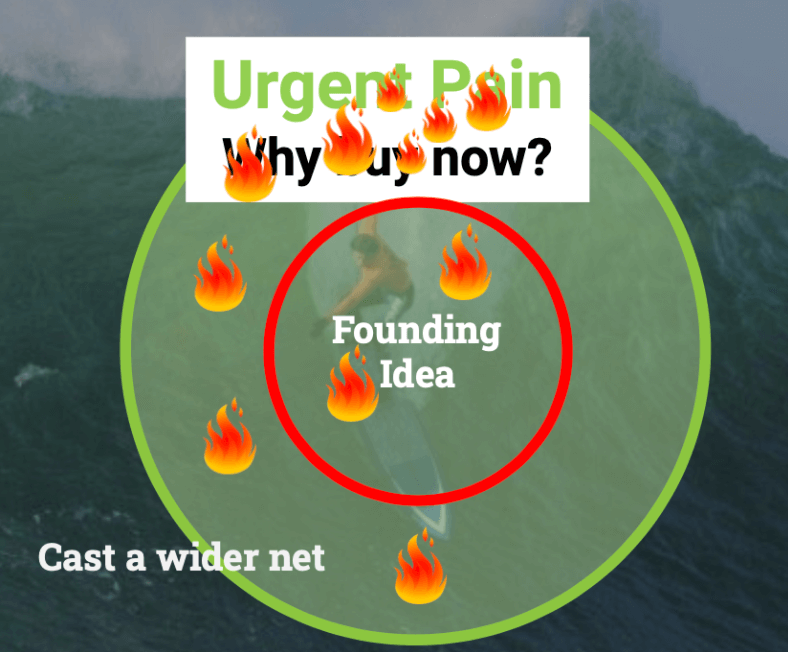
Every founder has a founding idea — the reason why they upended their life, quit their cushy job, and terrified their friends and family in the name of building something revolutionary. To the founder, this idea is the guiding light, the raison d’être that justifies all the blood, sweat, and tears.
Conventional wisdom tells startups to “focus, focus, focus” and drill down on the founding idea. But the truth is that overly dogmatic focus on the founding idea can be fatal. And as attractive as the founding idea may be to the founder, the urgent pain for the customer is often adjacent. It’s not exactly the founding idea. And it’s not the founder that’s buying your product. It’s the customer.
But to find the urgent pain, you must go against the conventional wisdom and overcome resistance. Changing the founding idea feels like heresy, but it may be the right thing to do. And the only way to find out is through experimenting, casting a slightly wider net — and listening to the data.
Test Adjacencies
Start with the initial focus on the product-market hypothesis, but also cast a slightly wider net for adjacent pain points and customer segments.
Targeting product-market adjacencies doesn’t come free. Testing them diverts resources from the original idea. There is no hard-and-fast rule on this, but spending 20–30 percent of your energy testing adjacencies provides enough coverage to detect a potential hotspot that may be outside the initial focus.
Ask customers “what other problems are you struggling with?” Deliberately meet customers in different segments. Ask probing questions “if we had such-and-such, what would that mean to you?”. Modify initial pitch decks to catalyze exploratory discussions. Be willing to test adjacencies with digital marketing, prototypes or mockups.
“One mistake I see startups make over and over again is to be too enthusiastic and pushy at the start. You need to read the room and sense where the customer is at. What do they need? What problems do they need solved? When I’m ready to buy, I’ll buy. And when I say I’m ready to meet tomorrow, be ready to meet tomorrow. Not next week.”
Ashwin Ballal, EVP & CIO, Medallia
Testing adjacencies complicates early sales calls, because they won’t be identical and will require some nimbleness. Emotionally, too, admitting the need to spend energy on adjacencies can be difficult for founders and first developers, since by definition they are passionate believers in the founding idea. Pursuing anything else can seem like heresy!
Document All Data — Even if it Feels Irrelevant
Finding the urgent pain starts with getting the data: talking to customers and documenting those conversations.
Talk to Customers
Who decides what the urgent pain is? Your customers do. And there’s only one way to find out about their pain points: talk to them. Ask enough questions and listen closely enough, and your customers are bound to reveal what’s really bothering them — and what they’d pay to solve ASAP.
Be Unbiased
Here’s a typical situation. The startup has two kinds of communicators: the Evangelist and the Listener. (They could be salespeople, though these personality types are not limited to sales. For example, the founder is often an Evangelist.) The Evangelist is articulate and deeply passionate about the founding idea; they’re a great spokesperson for the product. However, because the Evangelist has a strong idea of what the world should be, they’re not in tune to the customer’s perspective. When the Evangelist does listen, they selectively hear only things that reinforce their point of view. The Listener, on the other hand, is the complete opposite. The Listener may not be particularly well-spoken, but they’re great at paying attention to the customer, taking notes, and figuring out what’s relevant.
Though you need an Evangelist to win customers, you need a Listener, too, especially when you’re looking for the urgent pain. In the early days of the startup, the team has to have an open mind. If you’re too focused on the founding idea, you may miss the adjacencies. That’s why it’s important to document.
Document, Document, Document
If data isn’t recorded, it might as well not exist. Later on, it’s too easy to forget, or worse, selectively recalled to fit a certain narrative. The loudest voice in the room often gets the most attention — even if it’s wrong. Beware of internal biases and only listening to what you want to hear.
To avoid these pitfalls, verbatim documentation is critical. Starting from the very first sales call, the sales and marketing teams should make notes of everything that happens. What are your reps saying? How are customers responding?
Organizing data is key to analyzing it later. It’s helpful to have a template of questions for capturing feedback, like a spreadsheet or questionnaire.
Find the Patterns and Hotspots
With data in hand, the next step is to find the patterns. Fair warning: this next part will be exhausting.
Lock the Team in the Room
To identify the patterns in your data, lock your team in a room and grind through 20-40 customer deals that you both won and lost — one by one, on a whiteboard. Find out what happened in each one — and why.
Why does the whole team have to do this? Because all the information about your customer interactions is distributed across people’s brains, and each one of those brains adds its own biases. That’s why it was so important to document customer data. Because only data can cut through opinions, biases, and anecdotal evidence. The whole team needs to be together — to contribute their perspectives and get on the same page. They even have to agree on what questions to each potential customer and their specific wording.
This process will be painful. It will take hours. It will be worth it.
Challenge Box
Team Members Aren’t on the Same Page.
If you ask every member of your team what’s driving deals and what’s getting in the way, chances are you’ll get a slightly different answer from everyone. And that’s not all. Opinions, hierarchy, biases, and anecdotes all tend to get in the way of making objective evaluations. To find the urgent pain that drives deals, you must arm yourself with the data to cut through the noise.
Take 20 Won 20 Lost Deals: Answer the Key Questions
To work through the deals, start with the customers you have won, and ask these questions:
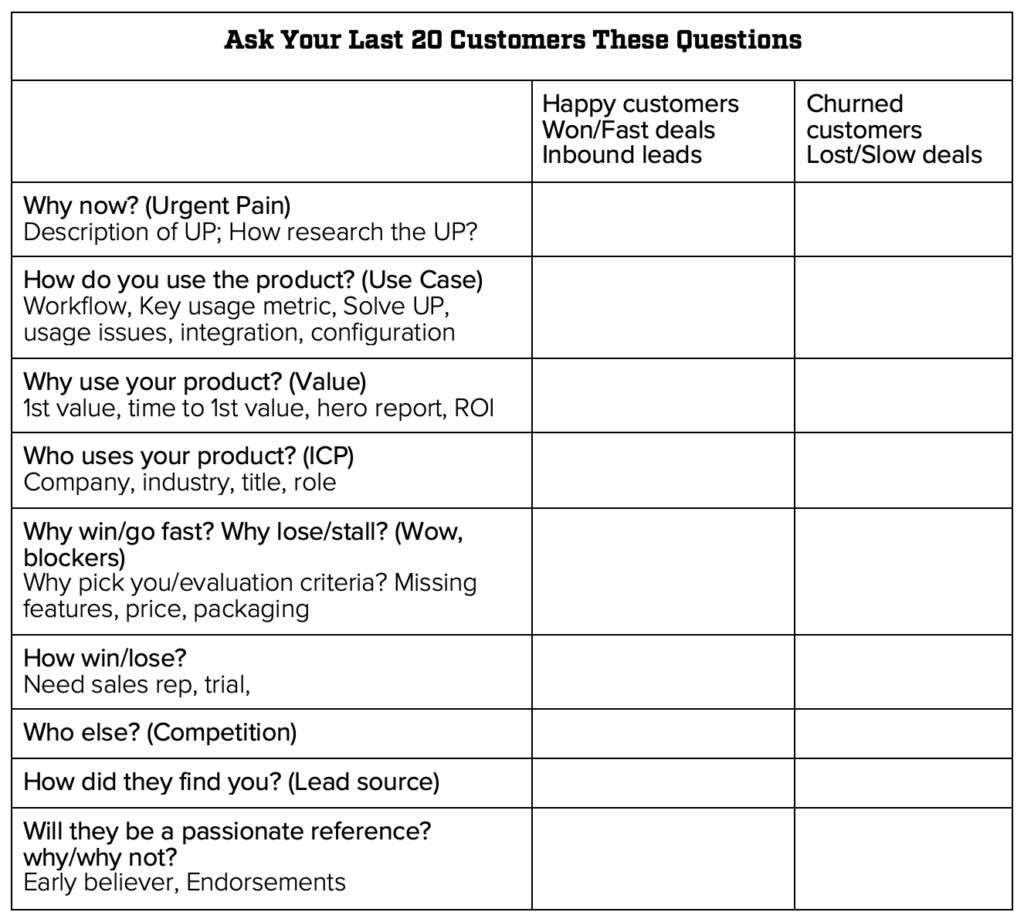
Patterns Will Emerge
As you grind through the deals, patterns will (hopefully) emerge. What drove interest? What drove deals to move? Which types of customers? What use case? Why did some slow down? Why did you lose? Are there patterns coalescing around the deals that succeeded? If so, these are clues. Deals that were lost can be equally instructive. Every win, loss, stuck deal, or uninterested customer is the world teaching you.
The key here is to move from anecdotes to analysis and visualization of patterns. It can be a very powerful exercise to bring together and look for patterns in the who, why, and why nots, and then make them visual. Often, a use-case/customer grid emerges with various hotspots and cold spots — around different potential ICP’s or different use cases.
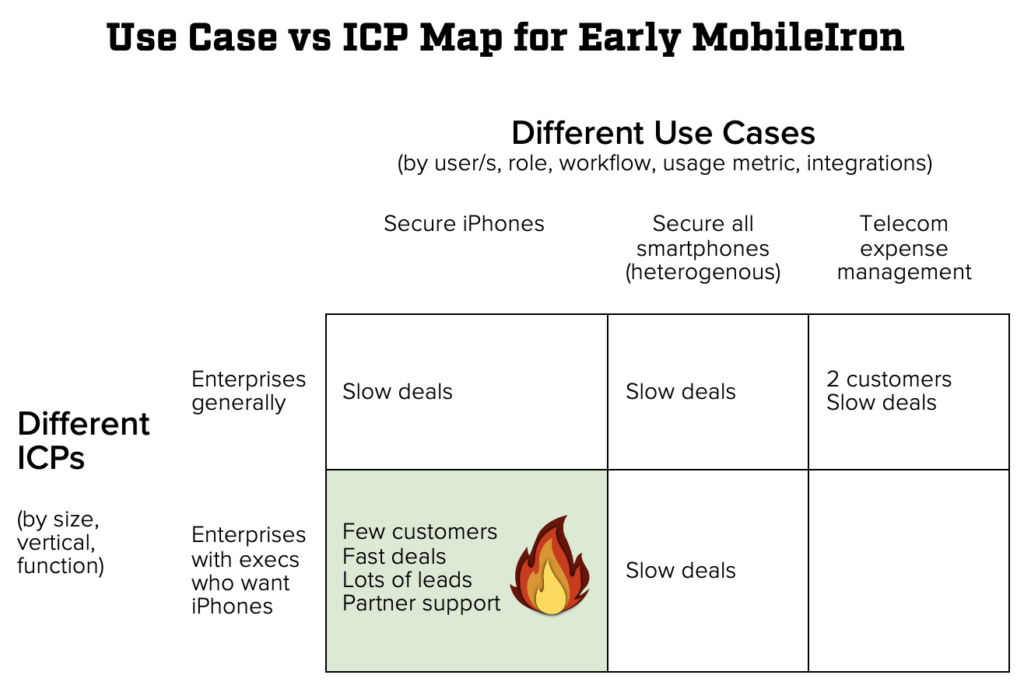
What you’re looking for is a repeated pattern of success with a certain kind of customer for a specific pain point. And when the data coalesces around a certain combination: bingo. You’ve found your hotspot — a combo of urgent pain and your Ideal Customer Profile (ICP).
Challenge Box
What happens if you have more than one hotspot? Painful sacrifice.
Often a startup achieves PMF, with customers clustered around the several hotspots. As a result, the GTM team now has a pipeline of potential customers clustered around those hotspots of pain points and buyers. Understandably, any deal that brings in revenue in a reasonable time attracts attention from the GTM team and absorbs GTM bandwidth.
GTM Fit requires making the tough choice to line up the GTM playbook and GTM resources on one or two hotspots with the most urgency, and then sacrifice both current customers and future legitimate customer opportunities that are tied to lower urgency problems. It’s painful. Sacrificing customers and legitimate customer opportunities will drive a revenue-goaled GTM team crazy who worked hard to win those deals. But it’s a necessary sacrifice. Building a repeatable GTM Playbook cannot be focused on multiple hotpots. You must pick one. Making the hard call to focus the GTM playbook on one hotspot (ICP/pain combo) is often the hardest decision to nail GTM Fit and unlock growth!
Examples: Urgent Pains that Unlocked Growth
Here are just a few examples of how B2B startups have pivoted to the urgent pain and unlocked growth:
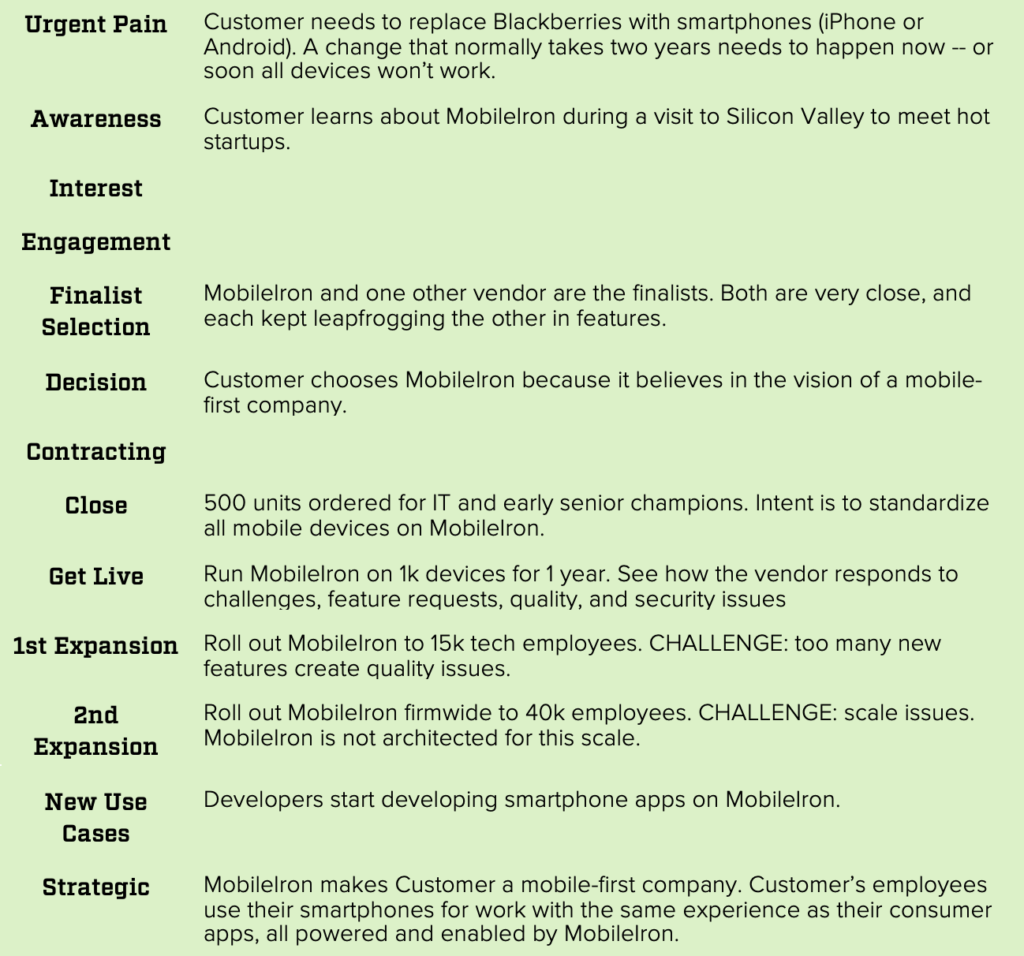
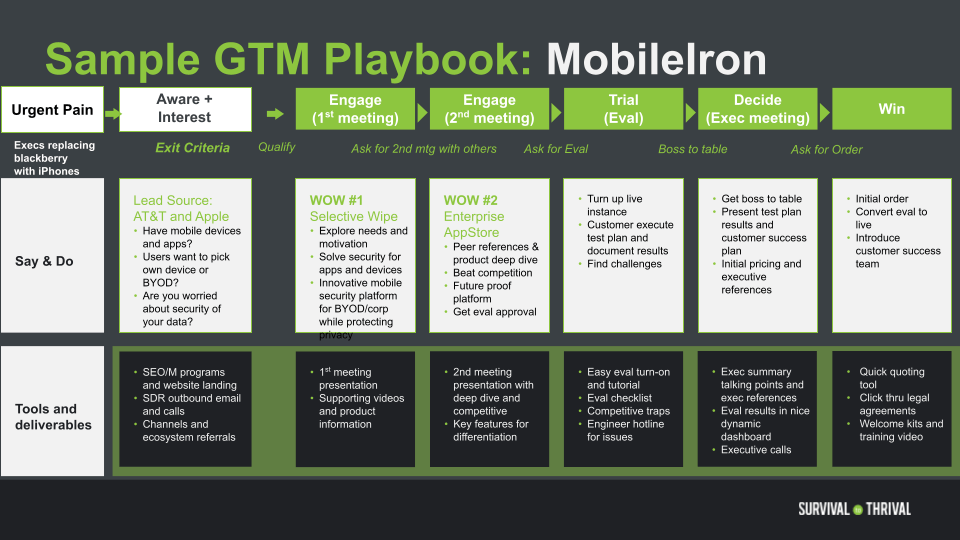
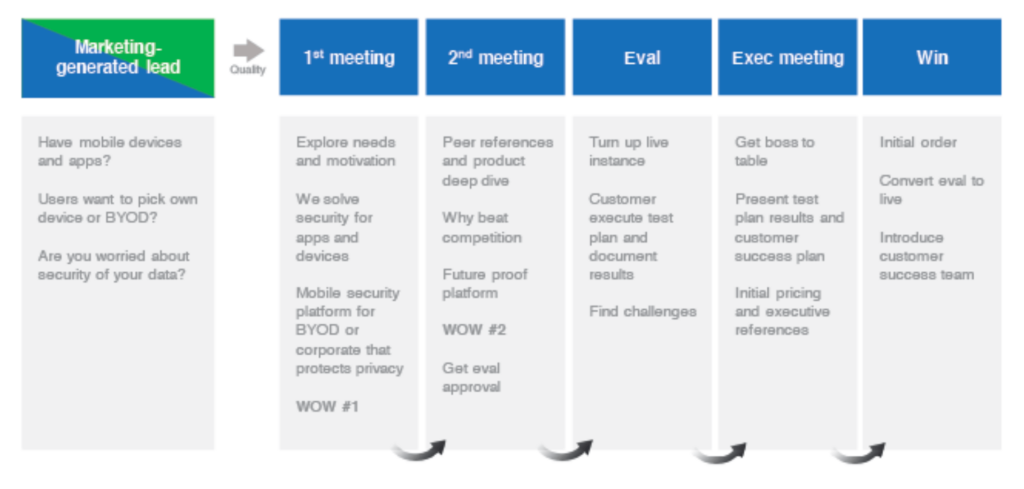
- MobileIron. MobileIron’s long-term vision of securely managed smartphones was attractive to prospects — but not enough to make them buy now. By listening to prospects, the team learned that execs wanted their IT departments to exchange their old Blackberries for iPhones — and they wanted it done yesterday. IT departments were hungry for a solution that helped them relieve the pressure from execs, and MobileIron could help them do just that.
- Sendoso. Early on, startup Sendoso built a platform that made it easy for customers to send a Starbucks gift card to prospects as a meeting-maker. But it turned out that an adjacent pain was much bigger and much more urgent. Marketing teams knew they needed to invest in the direct mail/gifting channel ASAP, but it was a nightmare to manually execute on sourcing, shipping, ROI tracking, and marketing/sales alignment. Sendoso could solve this pain by building a sending platform to automate the marketing closet of schwag for customers.
- Talkdesk. Talkdesk’s customers wanted to set up a call center, but the software was just out of reach for any company without robust IT. Talkdesk could solve this operational problem by allowing customers to set up a call center in only five minutes.
Common Mistake
Finding Urgency vs. Creating Urgency
It’s common to hear from the head of marketing that “we just need to create urgency” with the customers in order to sell the product. What’s wrong with that way of thinking? Instead of searching for your customers’ latent urgent pain, it means running around and scaring your customers into buying your product. It might generate a few sales, but it’s not a sustainable plan, because it relies on instilling fear rather than solving an existing problem. Taking the time to test adjacencies and discover the latent urgent pain is the only way to find a real path to GTM Fit.
Whether the startup stumbled upon the urgent pain by accident or extracted it through rigorous data mining to find the patterns, the takeaway is the same: without an urgent pain that answers the question Why buy now and not a year from now?, there is no GTM Fit.
Work Out the Full Customer Journey
Usually when execs think of the CJ, they think of “Lead, Land, Renew, Expand.” But that’s backwards! Startups need to look at the CJ through the lens of the customer — not the sales rep. The CJ is not the same as the SalesForce.com forecasting stages. The CJ stages come from observing what is actually happening inside potential customers as they engage with the startup. They capture the physics of the customer journey.
With the urgent pain identified, it’s time to work out the rest of the customer journey. So, lock your execs into a meeting room. Starting with the urgent pain, write down each stage of the journey on a whiteboard (see white rectangles in the diagram above for one example).
Nailing the GTM playbook is likely the first major cross-functional project that a team is forced to do, and getting everyone to agree on the stages of the customer journey will be a struggle. But it’s crucial that everyone get on the same page.
Here are some questions to use as a starting point:
- What is the urgent pain that your customers need to solve? Is it routine or existential?
- How do your customers find you — or you find them?
- How do they become interested?
- Who are the champions/evangelists of your product within the company? Is IT, the CFO, the marketing team, etc?
- How do they decide to engage?
- How do they select you and decide to buy? Who has to sign off?
- How do customers get live with the product? What are the typical expansion stages (250 users, 1,000 users, 10,000 users, etc)?
- What roadblocks must be overcome as they go live?
- Does your product expand by getting integrated with other workflows or support new use cases?
- How does the customer decide to renew?
- How do you become strategic to the customer’s business? What new problems are you solving for them?
Beating out the customer journey is hard. It requires distillation, conversation, and compromise. At times, it feels like a fight. But it’s absolutely essential that everyone has the same view of this journey, as it will drive the organization and produce key metrics.
Highlight 3 Key Milestones
Because the CJ stages represent the physics of the customer journey, no two companies will have the exact same CJ. That being said, we want to call out three important “milestones” that you should identify and highlight. (In our diagram, the 3 key milestones are overlaid over the top of the CJ stages). These are the most critical parts of the playbook, and will become important leverage points when you operationalize GTM. Make sure you can identify them in the CJ:
- The Urgent Pain. This is the pain point that drives the customer to buy now — not one year from now. (See “Find the Urgent Pain.”) Without the urgent pain, there is no GTM Fit.
- Time to First Value. This is the first point at which the customer gets value from your product. Shortening time to 1st value can dramatically increase and/or speed up conversion. So, make sure you identify: What is the first value? When does the customer experience it?
- Become Strategic Platform. If your product solves an urgent pain for the ICP, your foot is firmly in the door. But how do you pry the door all the way open, and keep it open in spite of competition from others who can solve the urgent pain? The answer is to make your product “strategic.” A strategic product has a long-term value proposition. It becomes a platform embedded in the workflow that people build off of. How can your product become a strategic platform for the customer? If you don’t know yet, that’s fine. We’ll discuss “How to Become Strategic” in the next section. Once you’ve read it, come back to the CJ and figure out how your product can be strategic.
GTM TIP
Time to 1st Value Can Differentiate SLG and PLG
Pay attention to the first time the customer receives value from the product. Is it before or after the contract is signed? If it’s afterward, you’re most likely to follow a more traditional sales-led GTM model. If the customer receives value before the first contract, through a freemium service for example, you’re probably a better fit for product-led growth (PLG).
Sales-Led Growth Example: MobileIron CJ at Major Customer
Here were the steps of MobileIron’s CJ at a major customer, from urgent pain to strategic platform:
Examples: CJ Spreadsheet
The S2T Customer Journey & Playbook Spreadsheet also includes sample customer journey stages. Feel free to make a copy and adapt it to your company’s own CJ!
Challenges and Common Mistakes
Challenge Box
A shared view of the customer journey is harder than you think.
Consider the parable of the blind men and the elephant. Three blind men have never come across an elephant before. As an experiment, someone asks them to touch an elephant and describe what it looks like. So each blind man takes his turn and touches the elephant — but they all touch a different part of the elephant’s body! The result? The three blind men have a different idea of what an elephant is.
While the startup’s leadership team is most certainly not blind, they look at each part of the Customer Journey through their lens and from their perspective. That’s only natural. Try this: Ask the leader of each team to write down their view of the Customer Journey. Probably, leaders are mostly on the same page for the GTM playbook, but they have a 20% different view. 20% different means 80% the same, right? Unfortunately not. The 20% on which the four leaders differ is actually a different 20%. That means 0.8 same x 0.8 same x 0.8 same x 0.8 same = .41 same. That means that, to the rest of the company trying to execute the startup’s GTM plan, the leadership team is only 41% aligned and nearly 60% misaligned on the GTM playbook, making it almost impossible to achieve GTM Fit.
How can one build a repeatable GTM playbook if the different parts of the company don’t have a shared view of the Customer Journey? Force these views to converge. It’s critical. The team must have the same view of the Customer Journey. It’s the backbone of the GTM playbook.
Common Mistake
The CJ Doesn’t End When the Deal Closes
For SaaS companies, the CJ doesn’t end when the deal closes. In fact, that’s when some of the hardest work begins.
JJ Juergensen: “The customer-vendor relationship is like any relationship. Everyone’s happy at the beginning. When you start having problems, when it’s tested, that’s when the strength of the relationship shows — or not.”
Bob: “When we operationalized MobileIron at JJ’s firm, there were a few times I got a call from JJ about a problem with the rollout, and I almost had a mini heart attack. Those were do-or-die moments. We had to fix it — or else. And we did!”For a major deal, getting the customer live won’t happen overnight. Usually, there are several stages of rollout, and each presents challenges that must be overcome. The startup must be responsive to the customer and solve these problems as soon as possible. Failure to do so can mean you’re dead in the water, but responding well to problems will build trust and support expansion, upsell, and new use cases.
Common Mistake
The Customer is Not the Entire Company
Your customers are individuals within the company. There will always be competing voices and interests in a sales process, so make sure you find a champion within the company whose pain point can be solved by your product.
Common Mistake
Don’t Be Too Responsive to Customer Requests
It’s always good to listen to the customer. But be careful not to listen too much and waste time on trivial requests. You’re likely to meet with a few prospects who tell you they want to buy your product, but only if you add one certain feature for them. Should you do it? If it’s a request you hear over and over, it’s probably worth your time to add this functionality. But it’s a waste of your time to add a different feature for every customer, because it will spread your product team too thin — and probably lead to low-quality code that will cause problems later on. Save your energy for the big roadblocks and customer requests that will come up during the implementation phases. How you respond after they sign a contract will make or break your success.
How to Win First Customers
Up to this point, we’ve talked about the “what” of the CJ. Now, it’s worth pausing for a moment to talk about the “how.” Namely, how do you get your first customers? As we’ve already discussed, the urgent pain is hugely important to winning customers. But in the early days of a startup, the urgent pain itself may not be enough. That’s because there is a “risk asymmetry” between the upside of your product and the potential downside of working with an untested startup. In this section, we’ll explain what risk asymmetry is, and how to break it to win first customers.
Risk Asymmetry
Early adopter customers — and granted, they are rare — will seek out early startups to work with because the partnership gives them leverage to shape the product to solve their urgent pain. While most customers won’t engage until you’ve already found GTM Fit, these early customers see your GTM Fit before your team does. They see the startup’s strategic value.
Ashwin Ballal, who championed MobileIron in the early days, is one such early adopter. He says his empathy for entrepreneurs comes from childhood, watching both his parents build companies in India. When his company faces an urgent pain, Ashwin regularly seeks out startups to partner with. Usually, those startups — including MobileIron, Moveworks, FireEye, and Delphix — tend to be very successful in the long term. In fact, Ashwin says that when he’s bet on a startup, he’s never lost.
However, early adopters like Ashwin are rare, and most customers view things much differently. To the average customer, the risk of partnering with a startup can seem higher than the potential upside. And these are the majority of the customers that you will have to win over.
Put yourself in their shoes. What does your customer stand to gain if your product works, and what does he or she stand to lose if it doesn’t? While founding CEOs are usually focused on the former, most customers are focused on the latter.
Founding CEOs start companies because they have a positive vision of the future in which their product changes the game. When customers adopt the product, it not only makes a positive impact on the company: it turns the product’s champions into the company’s heroes. But it’s important to understand that your customers will have the exact opposite mindset. When they evaluate your product, they aren’t thinking I hope this gets me promoted. They’re thinking I hope this works and doesn’t get me fired.
“In vendor selection, there is more downside risk than upside.”
–JJ Juergensen, MD of Cyber Risk, Barclays. Former MD of IT, Morgan Stanley.
Think about it this way: You identify new technology that works well, convince your boss to sign a contract, get it operational. There are no fatal glitches, and everything ends up working fine. You’ve made an incremental improvement in your company’s workflow. Result? Your boss is pleased. Do people know that you’re responsible for the upgrade? Maybe not.
Say you make a good vendor choice twice. Three times. That’s how you build a reputation for making good choices. You’ll receive praise, and probably get promoted. Sounds pretty good!
But what happens if you screw it up even once?
Your ass is grass.
“When we made the decision to adopt MobileIron at my company [a major investment bank], the stakes were high. The product had to work. If there was even one small blip on the trading desks, it would have been curtains.”
-JJ Juergensen, MD of Cyber Risk, Barclays. Former MD of IT, Morgan Stanley.
No one seems to remember who’s responsible for positive improvements, but somehow they always remember who royally mucked it up. If you convince your boss to invest in new backup technology, then you’re hit by ransomware and your backup doesn’t work? Well, then you’re going to be the person everyone talks about ten years later over beers. Poor Susan, if only she hadn’t convinced the boss to spend $4 million on that software, she wouldn’t have been transferred to a basement in Kalamazoo…
To win early customers, the startup must break risk asymmetry and prove they offer more upside than risk.
Break Risk Asymmetry to Get Early Customers
Both early adopters and normal customers are looking for something in common: a product that breaks risk asymmetry and provides a game-changing upside. Startups that break asymmetry usually share the following three characteristics. While #1 is essential to win customers in general, #2 and #3 are especially important for winning early adopters.
#1 The product addresses an urgent pain — and is easy to use.
Many companies win first customers by solving an urgent pain in an easy and intuitive way.
When Ashwin started as CIO of Medallia, he had 26 employees reporting to him — and 25 of them were doing customer support. The startup Moveworks, which provides AI customer support services, had the potential to drastically cut costs. In other words, Moveworks solved a very urgent pain with a huge potential payoff that attracted the attention of Medallia’s decision-makers. We talked at length about the urgent pain — and how to find it — in a previous section.
If the product’s too complicated to understand or clunky to implement, it may not matter that it solves an urgent pain. Making your product easy — to try, to buy, and to use — is a powerful way to attract customers in an organic, bottom-up way. You can read more about the “power of easy” from our interview with Jay Fulcher, coming soon.
Solving an urgent pain in an easy and intuitive way is critical to win customers. But to win early adopter customers like Ashwin, startups need two additional characteristics:
#2 Personal Commitment
Buying from an early stage startup is a risky proposition. That’s why the personal commitment of the founder and leadership team can go a long way to reassure potential customers. Early customers have the power to make or break the startup’s trajectory, and when the founder shows a personal commitment to those customers, it reassures them that their investment is worth as much to the founder as it does to them. You’re committed to not making them a fool. In fact, this is the core reason why Ashwin feels comfortable — and even prefers — to work with startups.
“When I come early as a customer, I do take some risk — but for me it’s a lower risk in some ways. That’s because if I get a commitment from the senior management, I know they’re not going to let me down. It’s a symbiotic relationship: we win together or we lose together.”
Ashwin Ballal, EVP & CIO, Medallia
The relationship between founders and early customers like like a marriage. Founders can show this commitment through regular open communication and transparency with their early customers. If something goes wrong, let the customer know, share a plan to fix it, and whatever happens, you’re going to deliver on your promises.
Common Mistake
Overpromise, No Follow-Through
“Too often I see founders overpromise and underdeliver. Instead of saying yes to every request, it’s better to be transparent and set realistic expectations of what’s possible. I’m well aware that you don’t have a lot of resources. All software is beta, it’s going to have some issues. As long as you’re upfront about a screw-up, it’s OK. We can move forward. But I tell every founder: it’s you that should be calling me. The moment I’m calling you, we’re over with.” – Ashwin Ballal
#3 Become Strategic — and Turn the Champion into a Hero
It’s hard to become strategic to a customer. Yet, every founding CEO believes their product is strategic. The truth is most products are a “Version 2.0”: an improvement that replaces an existing version 1.0 system. It does something your customer was already doing, but better. The challenge is that in the best case scenario, no one will notice a change from 1.0 to 2.0, unless the product fails.
A strategic product is something that people notice. It not only helps the customer solve the urgent pain, it has a long-term value proposition. Usually, it’s part of an increasingly important wave over time: digital transformation, cloud migration, mobile enterprise, or consumerization of IT. It opens up new possibilities that will have an impact on the company as it gets embedded in their workflow. When a product is strategic to the customer’s business, it becomes a platform, and people build things on top of it.
When competing for a new customer, there are probably other vendors that solve the urgent pain just as well. Offering a strategic product is what separates the best vendors from the rest of the pack. For example, MobileIron’s entry point pain was solving the urgent pain of secure smartphone email, BYOD, and getting apps. But its high-level strategic value was to enable the mobile workforce. Not only did MobileIron solve the problem of mobile security, it reframed the problem of How do I secure my devices? Instead, the question became How do you become a mobile-first company where smartphones become key devices for every employee? MobileIron answered the problem with a visionary long-term solution.
Sometimes a product is strategic because of the pain it solves. If the customer is facing an existential urgent pain that threatens their very survival, your product has the opportunity to save the company. However, most urgent pains are not existential. It’s up to you to make your product more than a 2.0. How can your product drive key business objectives for your customers and unlock long-term possibilities that would not be otherwise available? Finding the answer to this question is the key to becoming strategic and winning long-term customers.
“Whenever I partner with a startup, I assign someone from my organization to take the lead on the relationship. This champion knows that successfully deploying the new technology can change their career and get them promoted, which makes incentives line up very well for everyone to win.”
Ashwin Ballal
Like most things about startups, Ashwin understands the power of aligning incentives between the startup and its champion within the buyer. When a strategic product drives key business objectives, people notice. The champion who leads and deploys the strategic platform becomes a hero within their organization.
In part because of his work on integrating MobileIron into his company’s mobile platform, JJ was promoted to managing director, a 1 in 100 shot for any employee. How did that happen?
“The urgent pain that drew us to MobileIron was an existential threat. Our trusted platform — Blackberries — were going away. Our execs wanted to switch to iPhones, but we weren’t able to secure the devices. If we did nothing about it, in two years none of our tens of thousands of devices would work. Nothing clarifies the mind like knowing you’ll be hanged in the morning.”
-JJ Juergensen, MD of Cyber Risk, Barclays. Former MD of IT, Morgan Stanley.
Clearly the downside risk of not solving this problem was huge. But what broke the asymmetry and made the upside so big? The answer lies in MobileIron’s ability to tie the urgent pain to a strategic destination. To see how that worked, let’s take a step back.
At the time, there were two general approaches to solving the problem posed by securing new mobile platforms. The first was the container approach, in which all the apps on your phone are put into a secure “container.” It was a trusted, familiar model. But the downside was that the user would lose the native Apple iPhone experience, and could only use applications that were specifically made for the container. Users would still be using a Blackberry app — on their iPhones.
The newer, untested approach was to leverage the native Apple platforms through their APIs. It meant retaining the “real” iPhone experience, allowing developers to securely develop apps on the iPhone. But it was riskier, since it relied on new platforms like iOS. For a firm like JJ’s, the downside risk of a data breach was catastrophic. So which approach did they choose?
“When we were down to the final decision between two vendors to handle mobile security, both of them solved the security problem equally well. The difference was that MobileIron’s solution relied on native platforms, while the other vendor took a “container-based” approach to security. We ended up choosing MobileIron because they had a clearer vision of where they were going. They saw that in the long term, execs would want their business devices to work exactly like their personal ones. A container-based approach would quickly become clunky and obsolete. And that’s exactly what happened.”
-JJ Juergensen, MD of Cyber Risk, Barclays. Former MD of IT, Morgan Stanley.
Your goal should be to make your product strategic to your customers and turn your champion into a hero. But you need a way in the door. Your way in? Line up with the urgent pain.
Special thanks to JJ and Ashwin for all of their help on this section.
End the CJ by Becoming Strategic
Let’s talk about the end of the Customer Journey. The CJ doesn’t end with closing a deal. Ideally, it ends with your product becoming strategic to the customer and turning your champion into a hero. Here are a few pieces of advice on how to accomplish that:
Find the Hero Report
If your product has the potential to be transformational to an organization, you can help turn your champion into a hero — and a happy reference customer — by helping them create the “hero report.”
The end of the customer journey is when your champion becomes the hero of their organization. Help your champion create a “hero report” — a dossier of all they have accomplished using your product, something that they can present to executives that gets attention and gets them promoted. Your best users may have created the hero report already. Go find it. Then share it.
“I am perpetually surprised that companies don’t do this [make the hero report] for potential reference accounts every single time. It’s such an easy way to nudge a sponsor from simply happy to proactively driving your offerings.”
-JJ Juergensen
Market Revolution, Sell Evolution
When educating prospects on your solution to their urgent pain, be mindful of their risk asymmetry. The key is to enlighten them about your product’s strategic potential (the upside) while minimizing risks to them (the downside). In other words, market revolution — but sell evolution.

Startups can become thought leaders by attacking the conventional wisdom of incumbents — the old dinosaurs that are big but dated. Your startup is the unicorn, poised to charge and disrupt. Attack with thought leadership and create a passionate community around the strategic destination promised in your founding idea. Make it provocative, controversial, and ideologically pure.
“At Marketo, a marketing SaaS company I invested in, our customer champions were early leaders in the new field of “demand generation.” Pretty soon, CEOs were asking for marketing leaders who had experience with demand generation. Building a community around your ideas creates a “flywheel effect” — a virtuous cycle that turns success into leads.”
-Tae Hea
But most customers are not so revolutionary. They want support from the rest of the organization. They do not want to assume career risk and huge uncertainty. These customers, despite being a firm believer in the revolution, prefer an evolutionary approach. Help these customers by selling evolution, where each step delivers value to the customer to build confidence and overcome organizational resistance. This approach doesn’t place the champion at career risk.
Read More
Check out Tae Hea’s blog post, “Attacking with Thought Leadership.”
Don’t Educate on the Urgent Pain. Educate on the Strategic Possibilities
Once you hone in on the urgent pain that your product solves, you don’t need to spend a lot of time “informing” new customers about the problem. They already know it exists!
“Sometimes a vendor will spend over 50% of our meeting talking about the problem in the market. But I’m already very aware of that problem. I live that problem! I want to know about the solution.”
-JJ Juergensen
Instead, educate your prospects about the strategic possibilities: the new implications and actions your product makes available to them. How can you help them understand the problem in a new way and provide a solution that will open up new opportunities?
“The best vendors help you think and talk about a problem space internally in a way that didn’t occur to you before. They know where the puck is going, and what the different possible outcomes will be. They know problems they can solve for you not only now but in the future.
Another one of our vendors, Tanium, got our attention by changing the way we thought about a relatively sleepy space: systems management. They asked us: ‘How would your life be different if you could query every machine in your system to see if it’s running the current patch level of an OS — and get the answer in 3 seconds?’ That made us sit up — and think about problems and possibilities differently.”
-JJ Juergensen
The magic is laying out the journey from urgent pain to strategic outcome.
#2 Build the Right Surfboard: Create a Repeatable GTM Playbook
Once you’ve found the urgent pain for your ICP and understand the customer journey, how do you repeatedly find and win ICP’s that have the urgent pain? This is where the Go-To-Market Playbook comes in.
“When designing a board, I create [it] to fit the surfer and the wave… going for the ultimate surfing experience.”
–Jeff Clark, Mavericks Surf Company
Like a surfer’s surfboard, the GTM playbook should match the surfer (your team) and the wave (your customer journey). It allows the surfer to catch the urgent pain and ride the wave to growth.
The GTM playbook is a step-by-step, repeatable recipe to find and win deals over and over again. It becomes the blueprint for your marketing and sales teams. It becomes the bible for every new sales or marketing person to ramp. It becomes a powerful tool to align the rest of the team behind a go-to-market plan. The GTM playbook is the backbone for repeatable GTM that is the core of GTM Fit and unlocking growth. It’s that important.
What does the GTM Playbook look like?
Let’s talk about what the GTM Playbook is not.
- The GTM Playbook isn’t just a better PowerPoint pitch.
Many founders translate “GTM Playbook” into “I need a better PowerPoint.” The playbook is not a PowerPoint deck. Bob: “I learned the magic of the GTM Playbook from MobileIron’s early VP Sales, John Donnelly. The first thing John did when he joined MobileIron was to take our fledgling Playbook 0.5 and make it a real Playbook 1.0. I made the mistake of thinking this was just a sales-pitch thing. Boy, was I wrong. The playbook gathers and distills all sorts of things: value propositions, sales processes, customer engagement, and what everyone in the company needs to do to find and win customers. Playbook 1.0 became the core operating system for our go-to-market strategy and helped everybody in the company line up behind it. Nailing Playbook 1.0 played a key role in catalyzing the acceleration of our business in 2010.” - The GTM Playbook is not a “brain dump.”
The GTM playbook is not a thirty-page braindump of everything a sales or marketing person should know. Instead of documenting everything that could be done, the playbook is about capturing the 3-4 key things we do to find and win customers at each step of the process. That distillation often requires a painful sacrifice of perfectly good ideas that are not essential to the process. - The Playbook is not Playbooks, plural.
Finding GTM Fit requires the startup to choose just one GTM playbook. It’s just too hard to execute on multiple GTM playbooks as an early stage company trying to unlock growth.
What does a GTM playbook look like? The GTM playbook is a recipe to find and win customers over and over again. It has three main components:
- Customer Journey Stages: From urgent pain, to initial engagement, to win, to hero.
- GTM Actions (for each stage): What’s done/said? Who’s involved? Exit criteria?
- GTM Deliverables (for each stage): What does the rest of the company do/build to support that stage of the playbook?
Playbook 1.0 has to be simple. If the playbook diagram doesn’t fit on one to two pages, it’s not ready. Getting there is harder than it sounds. It takes distillation, sacrifice, and constant iteration on the ground with sales and marketing reps. Below is a sample GTM playbook:
How do you know you’re on the right track? A good sign is when new employees tape the GTM Playbook up on their wall. A spectacular sign is when the leadership team and entire company adopt the language and the framework of the GTM playbook to talk about the business.
How does the GTM playbook evolve over time? For most enterprise startups at any stage, crystalizing the GTM playbook for new customers is the highest priority. Once established, metrics are key to iterate and improve on the playbook. Once GTM Playbook 1.0 is nailed, the process to develop a GTM playbook is very repeatable and extensible. Startups often create additional GTM playbooks for upselling customers, renewing customers, new markets, and even bringing new products to market. Building GTM playbooks becomes a core differentiator and execution expertise for the startups that want to build a fearsome go-to-market machine.
So how do you create a Playbook 1.0? Take the following steps, and then iterate, iterate, iterate.
Seed the GTM Playbook: Learn from “Davy Crockett”
The early stages of an enterprise startup are like the Wild West. In the beginning, there is no GTM playbook. The founder, and maybe an early sales or growth marketing person, are the rugged pioneers. They experiment to find the path through the woods to find customers and win deals, each in their own way. They are the “Davy Crocketts.”

Through a lot of hard work and a dose of luck, one of them eventually finds what seems to be a repeatable path through the woods to find and win customers. This is a big accomplishment. Their self-found map is the “seed” of your GTM playbook. Write it down.
“During early sales calls we had a whiteboard outside one of the cubes that said ‘What worked’ on the right and ‘What didn’t work’ on the left. We took notes on what kept a customer on the phone, what got to a second meeting, what caused a customer to invest time, and what caused them to move forward. And soon a funny thing happened: other parts of the company started paying attention to that list. It influenced our marketing slides. When we hired new salespeople, we used it as our starting point in teaching them. We didn’t realize it, but those notes were our first draft of our GTM Playbook.”
-Bob
Davy Crockett’s map is a great rough draft, but it’s going to take more massaging. The playbook needs to be understandable, repeatable, and executable by the newest sales rep. It’s a concise recipe for conversions that are repeatable, and thus scalable and predictable. Refining that playbook means locking the team in a room — again.
GTM Tip
Evolution from “Hands-on”: Automating Parts of the Playbook
In the beginning when direct experimentation is high, most startups begin with a manual, hands-on approach for each stage in the playbook. While modern sales and marketing tools can highly automate parts of a GTM playbook, it’s often expensive to automate until you know what is to be automated. But once you figure out what works, automation can make your GTM more efficient in the long run. For example, in the beginning, early customer sales engagement is hands-on with scripts; later, it can be automated using marketing tools. Early marketing engagement processes can also be automated by being built into self-serve, product-led processes.
Challenge Box
What if Davy Crockett is the founder?
If the founder was the Davy Crockett who found the early path, there is a special trap to watch for. It’s a classic mistake to hire new reps and tell them “do what the founder does.” The GTM playbook must be executable by a mere mortal sales rep or growth marketer — not just a founder who has the “founder pixie dust” and gravitas that can open special doors, get special meetings, and make promises.
Challenge Box
Should your first VP Sales be Davy Crockett or Braveheart?
During the search for GTM Fit, one of the classic and most important questions is: When to hire a VP Sales? Conventional answer: When it’s time to start selling. Our answer: We generally disagree, for two reasons: (1) No grade-A VP Sales will be the first salesperson in the door, and (2) grade-A VP Sales don’t author playbooks from scratch—they finish and scale them.
The better early path to GTM Fit is to hire Davy Crockett–style salespeople who can “find the path through the woods” by iterating and experimenting on sales to find and win early customers. The Davy Crockett-style sales rep develops early versions of the Playbook and gets the company close to GTM Fit. A Davy Crockett-style sales rep is comfortable working with no map and insufficient supplies, and exploring the unknown. Most grade-A VP Sales will intuitively recognize the difference between PMF and GTM Fit and choose to wait for clear signals that the startup is close to GTM Fit. What’s the first thing a grade-A VP Sales candidate will want to do? Talk to early sales reps and early customers to see if there is a repeatable pattern that will scale!
Then, as the company gets closer to GTM Fit, it’s the right time to hire the VP Sales. An exciting startup on the cusp of GTM Fit becomes a very attractive opportunity for grade-A VP Sales. Once aboard, the newly hired VP Sales will polish the playbook, build an army, and then—like Mel Gibson in the movie Braveheart—lead the go-to-market army into battle against the enemy!”
GTM Actions: Who/Say/Do + Exit Criteria of Each Stage
What happens in each stage is the foundation of the repeatable sales playbook. Marketing knows what to do. Sales knows what to do. The playbook becomes a great teaching tool for onboarding new teams. But nailing all of the “say-and-do” stuff down is harder than it might seem. One company finished 50 percent of its playbook in three hours—but then took another three weeks to finish the remaining 50 percent! Distilling everything down to one or two pages forces focus and sacrifice.
This is where the CJ becomes very important. Under each stage of the journey, answer these questions:
- WHO: Who from the customer’s organization is involved?
- SAY/DO: What is said or done at each stage?
- EXIT CRITERIA: What are the exit criteria to advance to the next stage?
WHO: Remember, the customer is not the company. The customers are individuals within the company, and different individuals — and committees — are involved at each stage of the sales cycle. Who’s the champion? Is it someone from the IT department? Engineering? Does the champion have to get approval from higher-ups? Who makes the final decision to purchase?
SAY/DO: Try to get this down to 3-4 things per stage. What does marketing do to generate leads? What is the script for the first sales call? What do you say at the first meeting? The second meeting? What do you do during the eval? When do you get the boss to the table? How do you hand off to customer success?
EXIT CRITERIA: These vary based on the stage. Here are a few examples: Lead is qualified. Ask for a second meeting. Ask for an evaluation (eval). Bring the boss to the table. Ask for an order. Complete a contact. Sign the contract. Complete training and setup.
Everyone will have an opinion about what matters most. And everyone will have to sacrifice ideas or historical habits they cherish. The biggest debates will happen here. This is hard work and requires quality time, typically dedicated multi-hour blocks every couple days for several weeks. It is some of the most important GTM work that a startup team will do, which is again why the development of the playbook must be owned by the CEO.
Here is one example of Say/Do for a sales-led playbook:
Find the “Wows” and Identify Blockers
As you lay out your internal motion, keep an eye out for things that speed up or slow down deals: your Wows and Blockers.
What is a Wow? Every product or service that’s being sold has a “Wow!”—something in the pitch, the demo, the eval—that brings home the value proposition. A killer feature. A killer demo. A killer slide. A killer quote. Something that converts a moderate prospect into an energized opportunity, or from a trial customer into a champion for your product. A Wow is something that triggers an action from the customer and inspires them to move to the next stage of the journey. A Wow might prompt your customer to ask for more information, invite a colleague or boss, request a demo, or start a trial period. It nudges your customer to move to the next step of the customer journey.
How do you find the Wow? By listening to the customer. Here’s a typical situation: a founder is meeting with an early prospect, explaining the product and detailing this capability, that capability. The customer passively listens, until… they hear something that makes them sit up. Their body language changes. They lean in and say, “Tell more more about THAT.” That’s a potential Wow.
Who decides the Wow? Neither the founder, nor the sales person, nor the engineering team decides the Wow. The customer does. Listen to your prospects. Watch your prospects. Be warned: the Wow is often not the feature your engineering team is most proud of. Sometimes it’s a smaller function that is buried in your product — but is super interesting to the customer.
What do you do with a Wow? When you find the Wow, amplify it in pitches, build it into evals, and in some cases make changes to the product user interface to make it easier to find and demo. The Wow doesn’t have to be a major feature that’s frequently used in production by the customer. It just has to be a capability that causes the customer to engage and move forward in the GTM playbook.
Examples: Finding the Wow
- MobileIron. MobileIron discovered two Wows that made customers lean in and ask for more information: Selective Wipe and the Enterprise App Store. Selective Wipe was a feature that allowed IT departments to wipe work data from an employee’s phone without removing personal data. As employees started to bring their own devices to work, it used to mean losing all their music and pictures if they left their job. MobileIron found a way to selectively wipe work data — and made it easy to demo. The second Wow, the Enterprise App Store, was a private app store for companies where employees could get company apps. Though it wasn’t an important feature, it was an important part of the sales process. Customers saw they could have app stores for their employees — just like Apple’s.
- Talkdesk. TalkDesk found that their Wow was just how easy it was to use the product. They had simple, transparent pricing, signed short-term contracts, and we had a product that could be up and running in 24 hours. Put all together, adopting Talkdesk was a no-brainer, and low-risk compared to anyone else in the market.
- CloudKnox. CloudKnox, a cloud security company, addressed an urgent pain that automation had created for enterprise customers. For every customer, they found that there were 1-2 lines of code that could download or destroy all their cloud data, incurring huge regulatory risks. CloudKnox delivered a “Wow” by showing the customer which people in their organization had the nuclear keys to destroy all the data — in under 24 hours. That got customers to sit up.
- Vanta. Vanta helps small SaaS get through SOC 2 compliance, a certification that makes big companies feel comfortable using their services. The urgent pain was that SOC 2 compliance is confusing and expensive; it slows down and even deals. For prospects who had already gone through the painful compliance, Vaunta showed them how they could do it painlessly, with a dashboard that automatically updated every day.
Your Blockers are the opposite of your Wows — they’re what hold your prospects back from the next stage of the journey. Ask: What’s holding you back? What’s causing conversion to be slower? Common blockers include:
- missing features
- an execution issue
- a missing ROI analysis
- underwhelming demo
- onboarding is too hard
Blockers are NOT just “objection handling.” They can’t be solved by training the sales team better. They occur at all points along the playbook, and therefore must be addressed by the appropriate departments.For example, if your issue is the hurdle of the finance department, do an ROI analysis ahead of time, so your champion doesn’t have to.
Regardless of what your Blockers are, identify them and find a way to knock them out. Getting ahead of these problems will save time at crucial steps of your playbook.
GTM Deliverables for Each Stage
Under each stage of the playbook, clearly identify the tools and deliverables needed to support that stage in the playbook and move customers to the next. The list of tools become top priority deliverables for the team and becomes part of the muscle of the sales motion.
Defining the list also has a very beneficial side effect for the rest of the company: the cacophony of seemingly endless requests from the GTM team to the rest of the company now makes sense. The playbook becomes a very powerful way to line up the different aspects of an early stage company behind the GTM strategy. The playbook provides clarity and motivation to the rest of the company—engineering, product managers, marketing managers, support managers, and others—to see how the thing they are working on ties into the overall go-to-market plan for the business.
What kind of deliverables are on the list? Ask “What are the key things we need to nail this step in the playbook?” Typical deliverables include:
- sales tools
- marketing videos
- digital marketing SEO/SEM campaigns
- customer presentations
- key “Wow!” product features
- legal agreements
- evaluation guides
- onboarding guides
GTM Tip
Revise the PowerPoint to Match Davy Crockett’s Voiceover
Just as your pioneering Davy Crockett sales rep found their own personal path to find and win deals, they probably give their own effective presentation over the standard sales pitch deck. As you beat out the deliverables at every step of the playbook, it’s a good idea to revise the slides to match Davy Crockett’s “voiceover.”
What is Product-Led Growth (PLG)?
While product-led, self-serve platforms like Dropbox or Zoom are more common for direct-to-consumer business, the product-led playbook is taking off right now in the B2B space. Because PLG delivers value to customers immediately, it builds trust through transparency and collapses the sales timeline.
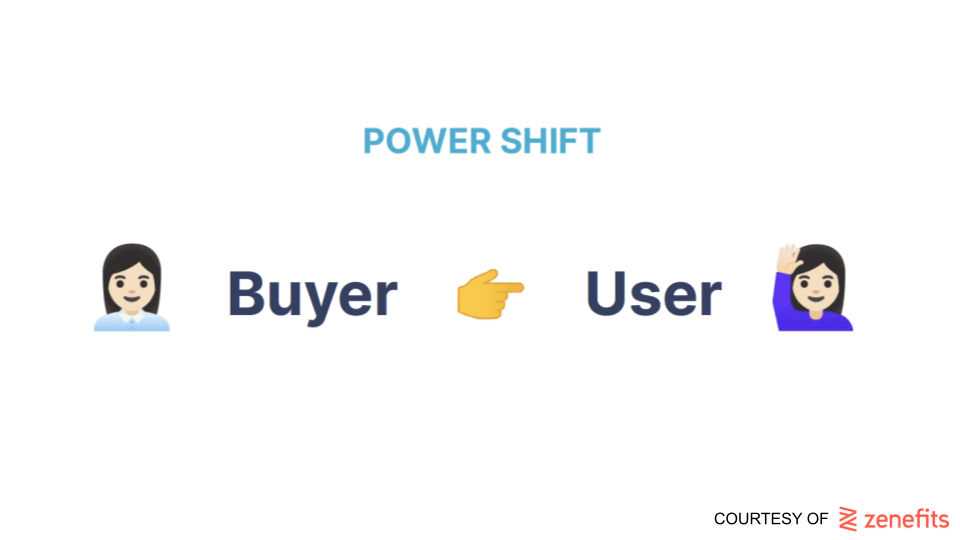
What is product-led growth (PLG)? “Product-led growth is a bottom-up approach to go-to-market,” says Jay Fulcher, CEO of Zenefits. “It’s in contrast to the top-down approach that’s typical of a sales-led motion.” In the traditional GTM model, sales reps first approach the economic decision-makers of the company, who are not typically the end-user of the product. PLG is the reverse. Instead of talking to the top brass holding the purse strings, PLG starts with the user who will actually use the product, approaching them with a self-serve approach that allows them to explore and test the product before they buy.
PLG vs. SLG: Which to Use?
Which is better for your company: PLG or SLG approach? Pay close attention to how the customer “makes the decision to buy” as you’re winning early deals. Not the logistics of the decision, but the cognitive process for how a company engages with and buys your product.
- Committee decision? That’s usually best handled by a sales-led process. Oftentimes the customer champion is unfamiliar with how to build an internal consensus to approve the purchase. A good salesperson leads the customer through their decision and helps the customer champion build that internal consensus.
- User and Decider are two separate people? Marketing-led tends to work here. Much of the early engagement and selling can be done by marketing, and perhaps sales comes in at the end.
- User and Decider are the same person? If the product is reasonably well understood, a self-serve product-led approach GTM motion is often best.
As a general rule of thumb, PLG works best when first value occurs before, rather than after, signing the first contract. It’s also helpful when the economic buyer and the end user are the same person — or at least work closely together. These two conditions a little bit of chicken and egg, especially when you’re building your first GTM playbook. So it’s better to ask: is my product use case amenable to a first value before the contract? Is it amenable to a user that is close to, if not the same as, the buyer? If so, some or all of the elements of PLG will be useful for your GTM. In fact, the GTM playbook doesn’t have to be one or the other. In fact, many B2B startups will benefit from using a hybrid approach that uses PLG to land customers and SLG to expand those customers using the customers’ own data.
GTM Tip
PLG is great for selling to engineers
PLG is especially impactful for products aimed at software engineers — like Twilio or Stripe — where the end user’s experience of the product can greatly influence the evaluation and purchasing decision. If the engineering team builds your product into their workflow, no one’s going to take it out!
At the startup SendGrid, PLG started with the founders wanting to build software to make the lives of developers better and easier, and that meant minimizing time spent with salespeople. At Zenefits, Jay decided to implement a PLG playbook alongside the existing SLG playbook in order to capture small and mid-market customers. “Before PLG, we had great product-market fit,” says Jay. “And our market is the 32 million companies in the US with less than 500 employees.” But 32 million is a big number! “Our sales team just couldn’t deal with the level of organic demand in a cost effective manner. We couldn’t ignore the market, so we had to change.” PLG helped Zenefits meet that demand. “Our customers wanted to move much more quickly, be more educated and self-sufficient,” says Jay. “We built a PLG system to activate their ability to see in our technology the solutions they’re looking for.”
At the same time, the PLG system Jay’s team built accelerated upmarket deals, because sales reps could give decision-makers instant access to the product. “Our marketing team built a buying center to help accelerate larger deals and assist buyers with ROI, and business cases to make a clear competitive differentiation.”
What about a seed-stage company that just found PMF? Should they start with traditional sales and add PLG later? We don’t believe there’s a one-size-fits all GTM model. The playbook you build should be based on your product. And while a product-led approach helps to close deals for small and mid-market customers or small teams within large customers, sales and customer success reps should lead the way for upsells. For a company that is looking to win customers upmarket, a sales team will always be essential. That being said, Jay has a particularly optimistic view of PLG:
“I do have a very strong opinion on this subject. If you can, it’s ideal to start with PLG.” That’s because a sales-led model can get the company focused on the wrong things. In old-school sales, you’re looking at how to get the attention of the economic buyer, not solving the problem of product-market fit. You’re trying to take the customer by the heels, turn them upside down, and shake money from their pockets. The focus is on how to extract money from the buyer, rather than to deliver value to the user. If instead you build a product that delivers value to the user and a process that helps the user see that value, you now have a product that sells itself.”
–Jay Fulcher, CEO, Zenefits
Key to PLG: Make it EASY
Jay’s formula for PLG comes down to this mantra: “Make the product easy to try, easy to buy, easy to implement.” Achieving “easy” is easier said than done. But when it’s done correctly, the results speak for themselves. “The day we implemented a self-serve demo and checkout for the product, we had $250k more in revenue overnight,” says Jay. “It was stunning, and it showed us just how much demand there was downmarket. Now it’s over 20% of our business.”
Why is “easy” so powerful? “Customers don’t want demands placed on their time,” says Jay. “With PLG, customers can do the evaluation on their own time. There’s no sales pitch. No discovery process. They can actually touch and use the product instead of hearing about it from a sales rep.” When the customer drives the sales process, the transparency around the technology sells the product. As Jay says, “Customers feel like they’re getting helped, not sold.”
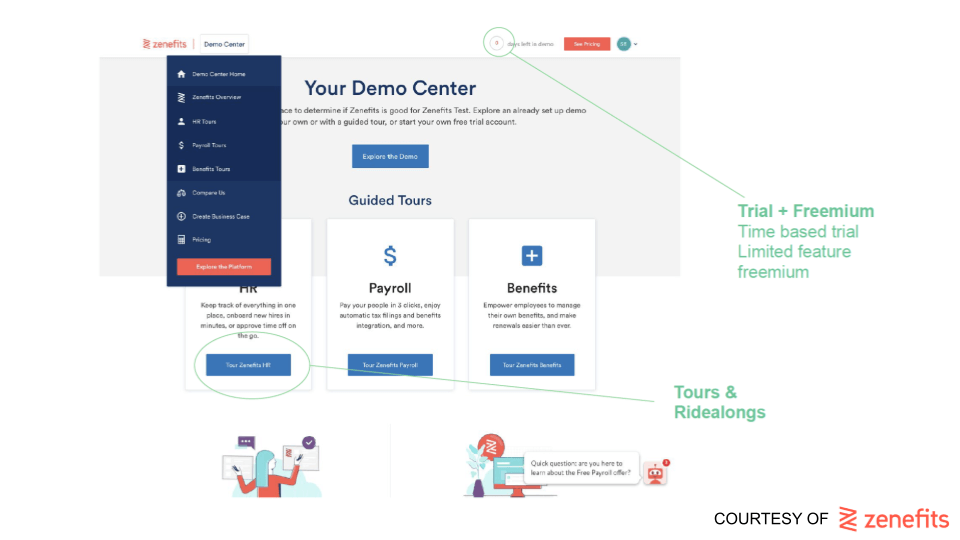
A good way to measure easy is time to first value. Shortening the time to first value can shorten the sales cycle from months to days — or even hours. Zenefits’ website delivers immediate value by allowing prospects to demo the product using their own company’s data and see for themselves how it works. “At times we’ve had a lot of customers in the demo stage waiting to ask clarifying questions before they buy,” says Jay. “Then our team moves to follow up, only to find they’re already under contract!” Never. Underestimate. Easy.
Sample Playbooks
Below is a comparison between common sales-led and product-led playbooks.
Example: Sales-Led Playbook, MobileIron
GTM Model: MobileIron followed a sales-led playbook where marketing generated leads and then handed off qualified leads to sales which then moved them through the sales stages.
Marketing: lead with the 2-3 story hooks to grab customers’ interest. Tools focused to drive leads and qualify them. Goal: convert leads to become 1st meetings.
1st Meeting: introductory call or webinar with simple messaging and education. Tools included presentations, simple videos, and the first Wow (show separation of work and personal data on a BYOD device). Goal: 2nd meeting for deep dive meeting with relevant parties.
2nd meeting: deep dive meeting with business and technical stakeholder. Prove value proposition, share long term vision, and provide peer references. If necessary, drill into competitive differentiators. Tools are more technical, plus the 2nd Wow (the “Enterprise App Store”). Goal: customer commitment to spend time on a product evaluation, which means customers get serious.
Evaluation: Customer live evaluation of product to prove value proposition and competitive superiority. The hard part: mobile was new; customers often didn’t know how to evaluate. Therefore, a critical tool was the evaluation checklist and test plan to help the customer, and of course highlight advantages. Evaluation checklist was a living document regularly updated due to new capabilities or competitive tactics. Goal: Ask for executive meeting to present results of test plan. The evaluation stage content was reverse-engineered to maximize impact of executive meeting.
Executive meeting: Present successful evaluation report, share long-term vision of company, and discuss execution capabilities to ensure successful product rollout. Tools include evaluation report, executive presentation, and personal calls from CEO or other company leader. Goal: business approval to select MobileIron and buy.
Win: Sign initial order and begin rollout and activation. Tools include quoting tool, legal agreements (preferably click-thru), and customer onboarding program. Goal: successful rollout and happy customer who buys more.
Example: Product-Led Playbook, Zenefits
A PLG playbook differs from the sales-led playbook in that the customer receives value before signing the first contract, “leads” are new free active users rather than new pipeline, and the “land” is covered by a self-serve, digital process rather than sales. Internally, Zenefits groups its playbook into four big-picture stages: acquisition, activation, retention, and expansion. Each of these has two or three key metrics to measure results (see diagram for details). “The headlines are bookings, churn, and margins,” says Jay. “And then, how efficient is your process that’s driving those bookings?” Zenefits’ website has over 1 million visitors per month, and Jay’s team has implemented a system to track activity and users through each of the customer journey stages: visitor, repeat visitor, lead, demo lead, in package, in checkout, closed onboarded, active.
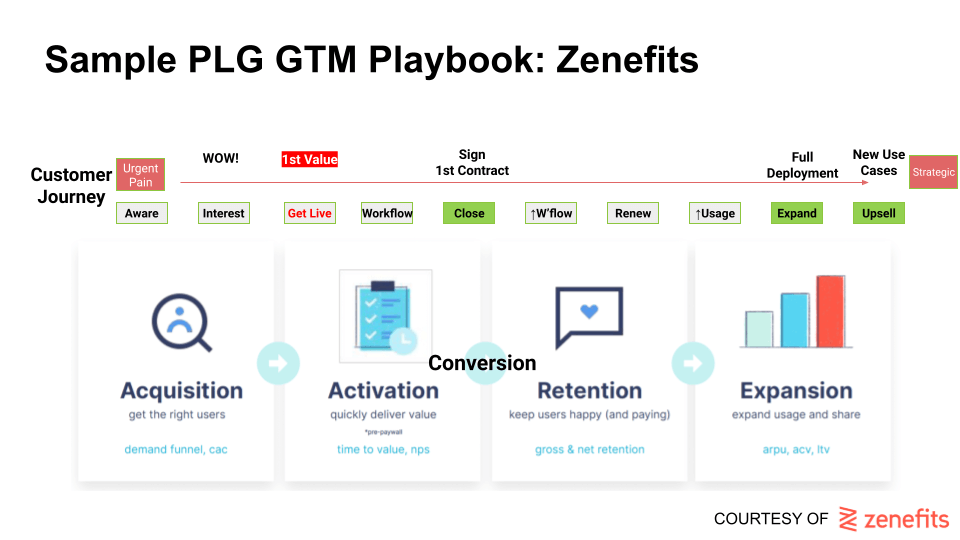
However, as mentioned previously, Zenefits does not run only a PLG playbook. Instead, it runs PLG and SLG playbooks concurrently, where parts of the PLG playbook augment and help accelerate the sales-led side. To channel customers into the right playbook, Zenefits segments the market into two different ICPs. SLG is for larger businesses, while PLG focuses on small and medium-sized businesses. On the SLG side, elements of PLG help close large businesses by helping potential customers try the product, eliminating the need for trials or POCs. SLG can also complement PLG. For example, at Zenefits the sales team steps in after the first contract is signed, to spearhead expands and upsells. Maintaining these simultaneous, interconnected playbooks requires strong cross-functional alignment, which we’ll discuss more in detail in Part 3.
Link: Playbook Spreadsheet
Here is a link to the S2T Customer Journey & Playbook Spreadsheet, which includes several examples of customer journeys and GTM playbooks, including the MobileIron playbook.
Review: Key Takeaways
Beating out the GTM Playbook is a long process! Here’s a review of the steps to building the playbook:
- Find the urgent pain. Without the urgent pain, there is no GTM Fit.
- Work out the CJ. The CJ is the backbone of your playbook.
- Learn from your Davy Crockett — your pioneer sales rep who found their path through the woods to repeatable sales.
- Define each stage of the customer journey — from the customer’s point of view. Overlay the seven key CJ milestones.
- Write down the 3-4 things that your company says and does at each stage of the CJ.
- Identify Wow’s and elevate them in the playbook. Identify Blockers and find a way to knock them out.
- List the GTM deliverables for each stage of the CJ.
- Figure out which is best for your company: SLG, PLG, or a hybrid of the two. Some or all of the elements of PLG may be useful even for a SLG GTM.
Ready to Move On?
Not so fast! Laying out the customer journey and your do’s and don’ts can seem deceivingly simple. But in our experience, this part of working out the playbook takes the most blood, sweat, and tears. Disagreements come up, outlooks clash… and that’s okay! This is the time to work through differing opinions and reconcile them. When everyone’s looking at the same picture, you’re ready to put the playbook in motion.
#3 Ride the Wave: Operationalize the GTM Playbook
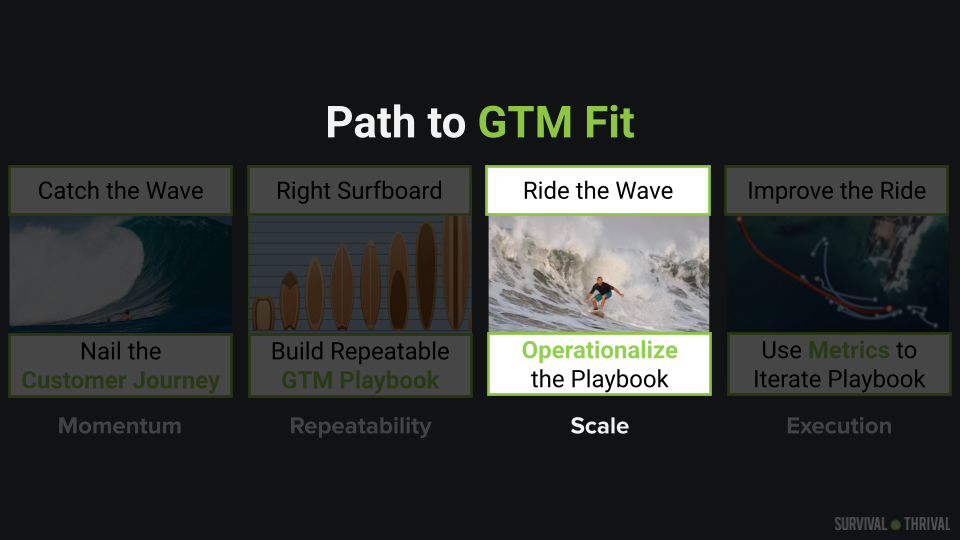
Now that you’ve found the urgent pain, defined the customer journey, and built your GTM playbook, it’s time to put things into motion. And just as a surfer balances on top of the board, riding the wave is all about careful coordination.
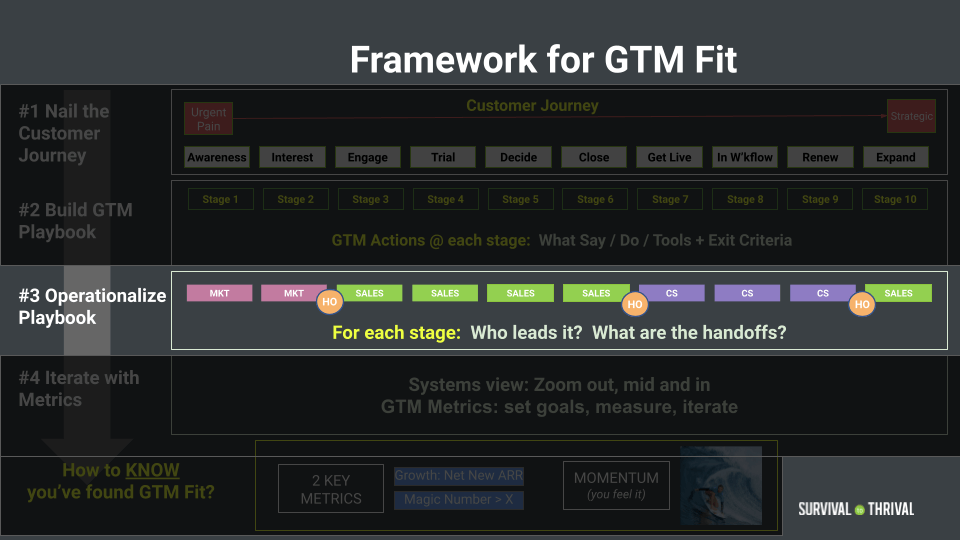
Here are the key steps to operationalize the GTM playbook:
- Get the team behind the playbook.
- Assign a leader for each stage of the customer journey.
- Identify the handoffs where the playbook crosses between teams.
The CEO Owns the End-End Playbook
First things first, the GTM playbook needs an owner: the CEO.
Why the CEO? First reactions to the GTM playbook are usually the same: “Oh, that’s just a sales thing.” Except that the GTM Playbook is not just a sales thing — it’s an everyone thing. The GTM Playbook cuts across marketing, sales, product, and customer success. It’s the most cross-functional project there is in a startup! The CEO is the only person with the visibility to see across the company — and the authority to get the whole company behind it.
Common Mistake
The CRO Doesn’t Own the Playbook. The CEO Does.
In some companies, the CEO delegates the GTM playbook to the Chief Revenue Officer, who is responsible for Marketing, Sales and Customer Success. This reduces cross-functional challenges. But the ultimate answer to most GTM issues is product related — and the CRO is not responsible for the product.
While the CEO owns the end-end playbook, each stage will have a leader assigned to it.
Each Stage: Decide Who Leads
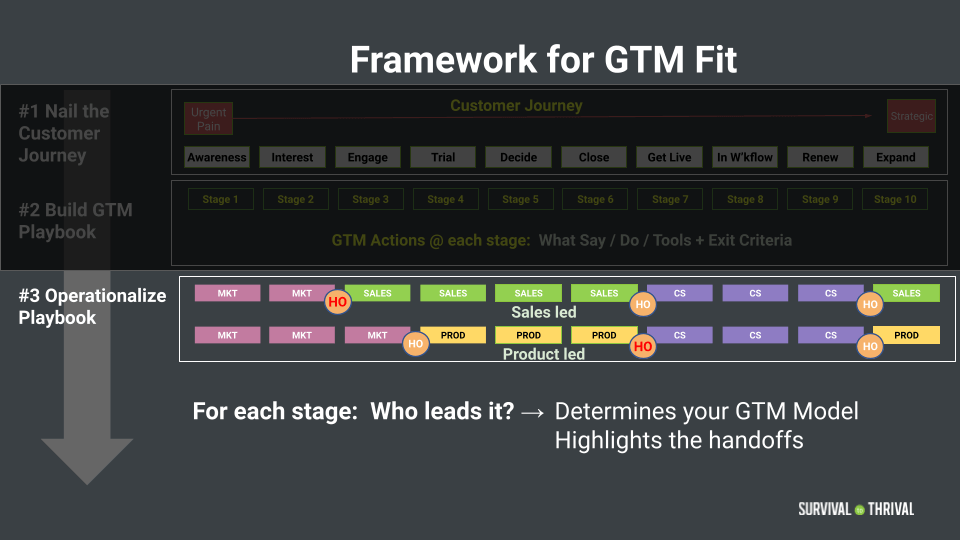
It’s time to get back to the whiteboard! Underneath your Customer Journey, identify which department or function takes the lead for each stage.
How do you figure out who leads what stage? By considering two inputs. Input #1 is your initial thesis about your GTM model. Do you think it’s sales-led, marketing-led, or product-led self-serve? This thesis might turn out to be wrong, but it’s a helpful starting point.
Balance Input #1 with Input #2. Input #2 is the observations you make as you are winning your first couple deals. Ask: How does the customer decide to buy?
Watch How the Customer Decides to Buy
To decide which team leader is responsible for which section of the playbook, pay close attention to how the customer “makes the decision to buy” as you’re winning early deals. Not the logistics of the decision, but the cognitive process for how a company engages with and buys your product.
- Committee decision? That’s usually best handled by a sales-led process (see diagram for example). Oftentimes the customer champion is unfamiliar with how to build an internal consensus to approve the purchase. A good salesperson leads the customer through their decision and helps the customer champion build that internal consensus.
- User and Decider two separate people? Marketing-led tends to work here. Much of the early engagement and selling can be done by marketing, and perhaps sales comes in at the end.
- User and Decider are the same person? If the product is reasonably well understood, a self-serve product-led approach GTM motion is often best (see diagram for example).
These bottoms-up atomic stage decisions in the playbook are the basis of your GTM model. While you’ll probably find your playbook resembles one of the standard GTM models (sales-led, marketing-led, product-led), there’s not a one-size-fits-all model to fit the playbook. Building your playbook from the bottom up will provide you the specific model that works for your business. No matter what is your GTM model, the most important thing is to make sure that everyone is aware of where they fit in, and what role they play.
Identify the Handoffs
Moving through the stages of the GTM Playbook is like a relay race — passing the baton from one leader/team to the next. And like a relay race, the handoffs are where races are won or lost: the baton is either smoothly handed to the next stage, or it’s fumbled.
Examples of handoffs are:
- Marketing hands off the lead to a sales rep.
- Marketing hands off a prospect to a self-serve demo.
- Online eval activity gets handed off to inside sales.
- Sales hands signed customer to customer success for activation.
- Customer success identifies an upsell opportunity to hand off to sales.
In the graphic at the beginning of this chapter, there are handoffs from marketing to product to sales to customers success, and back to sales for renewal. There are many possible configurations depending on your CJ and who leads which stage.
Handoffs are key. They are the most vulnerable points of the customer journey, where leads, prospects, opportunities, and deals get dropped or stuck. Handoffs are places where clear communication between teams is critical. Where deciding shared handoff success metrics is particularly important. Where operational complexity shows up. Where the CEO may have to get involved to resolve issues. Crisp handoffs in the GTM playbook help the business accelerate; sloppy handoffs are where things get stuck and slow down.
Challenges with Handoffs
Handoffs are tricky. When handoffs are not clear, problems arise. It’s pretty normal. Here are some examples:
- Misaligned leads. Marketing is using customer profiles, search terms, and messaging that drives lots of leads, which feels like a success. But those leads don’t have the urgent pain or use case that requires the product. The leads don’t fit the ideal customer profile.
- Misaligned deals. Sales teams are given incentives to go after large upfront deals, yet the sales playbook and historical deals point to a small initial deal followed by expansion. Deal pursuit doesn’t match the playbook.
- Misaligned product focus. The “Wow!” capability that motivates the customer to act is seen by the product team as unsexy and technologically uninteresting, and therefore doesn’t get proper engineering attention and marketing awareness. The product team has not elevated the “Wow!”
- Misaligned Problem or Use Case Across Functional Teams. The most fundamental and common misalignment is when all teams are not pointed at and prioritizing the same problem or use case. This is particularly common as the startup adds new executive leaders for each of the different functions. Everyone is moving fast and has a slightly (or not so slightly) different conception of the problem or how different customers experience the problem. The answer: the CEO and the team executives must force themselves and the company to line up on the same early use cases and customer focus. Easy to say, hard to do.
Sometimes the problem is a poorly defined handoff. Frequently, handoff issues are a symptom of a larger disconnect. Different parts of the organization — typically sales, marketing, and product — are not lined up on a common GTM playbook. Or perhaps, the team is aligned on 80% of the playbook and not aligned on 20%. No one is being malicious or stupid. Sometimes it’s a lack of clarity. Sometimes it hides a fundamental disagreement about GTM strategy. The key is to drive to clarity and repeatability.
Handoff Examples
- Marketing to Sales. Sales can only close as much pipeline as it receives — but not all pipe is created equal. Marketing should focus on quantity and efficiency (handing off the largest amount of pipeline in the most cost-effective way possible), but also make sure it’s high-quality pipe that sales can close.
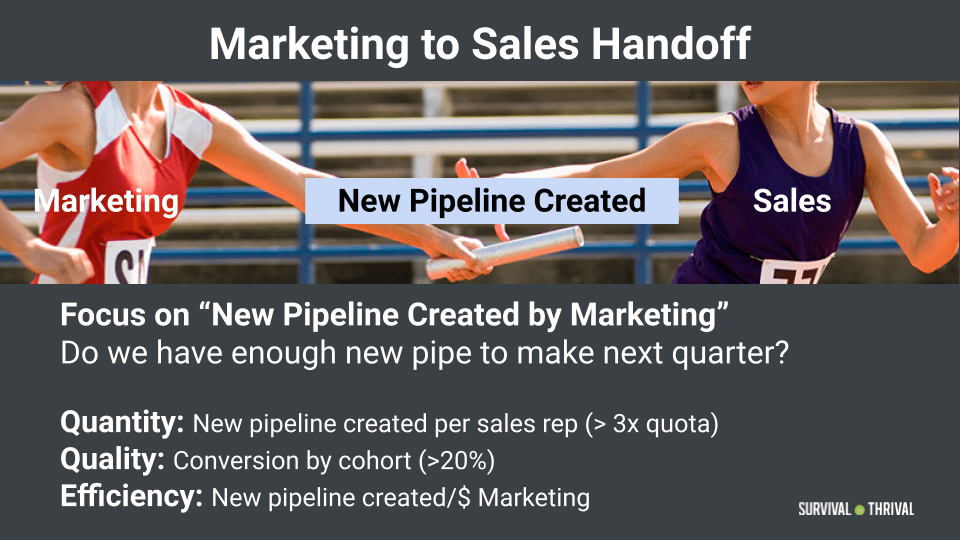
- Product to GTM. Though product has not traditionally been considered part of Go-to-Market, nowadays it’s an increasingly important part of the GTM playbook, especially for SaaS companies. Decreasing Time-to-Value (the time at which the customer first receives value from your product) is an example of a product change that drives GTM results. The graph below shows a product’s Time-to-Value (in minutes) plotted against the number of self-serve paying customers. As the product got easier to use (through faster Time-to-Value), self-serve exploded.
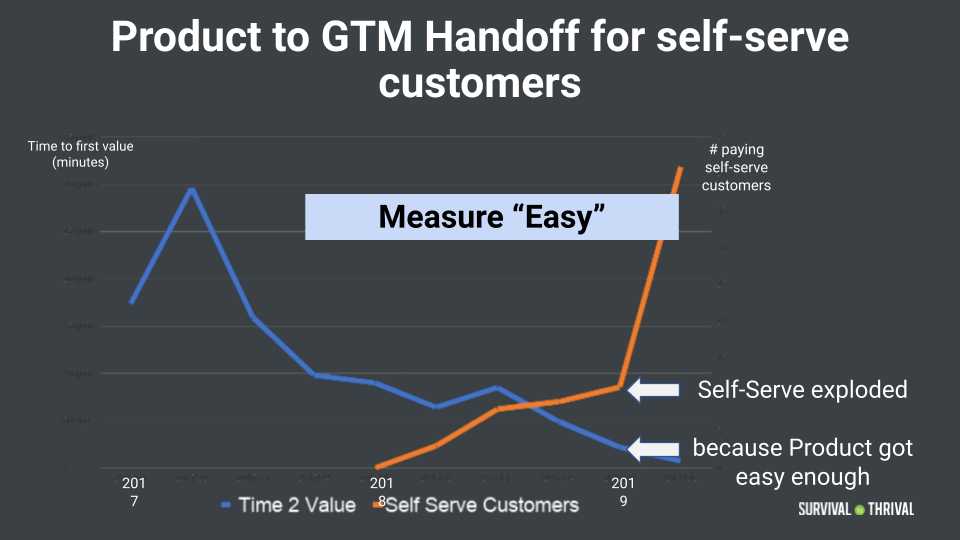
- CS to Sales. Upsells and expands are a key part of any SaaS business. When CS identifies a customer to upsell, there should be a clear and easy way for them to hand off that customer to sales.
Operationalizing PLG
Putting a PLG playbook into practice deserves some extra consideration, since many companies now adding PLG need to reorient their organization around a new process. For example, Zenefits started as a freemium service, before pivoting to a SaaS sales-led playbook. But with SLG, the sales team did not have the capacity to reach the low end of the market in a cost-efficient way — and were even about to abandon it! Instead, Jay’s team embarked on a two-year journey to create an incredibly successful PLG playbook to capture SMB customers. How did they do it?
“PLG is not for the faint of heart,” says Jay. “It takes a lot of time and investment.” For Zenefits, it took around two years to develop and test their PLG system, which includes everything from a demo center to an AI that delivers the right action and pathway to the right user at the right time. Soon, they realized that SMB customers wanted to make a buying decision, so they added a paywall and a “buy now” button. Adding that feature alone brought in $250k overnight.
Org Insights
Setting up a PLG playbook requires cross functional alignment and clear demarcation of roles. Initially, Jay’s team tried to make the change incrementally. “But that didn’t work,” he says. Because PLG impacts everything in the organization. Teams need to work cross functionally. “PLG has to be set up holistically, and everyone needs to know where they fit in,” says Jay.
Sameer Dholakia, CEO of SendGrid, believes a self-serve GTM model requires the full commitment of the company—across marketing, sales, support, and, most importantly, product. When Jay created a dedicated PLG team, they saw a 10x improvement in PLG metrics. Each function of the company then designated members of their team to handle PLG functions, though PLG has its own bookings target. “The head of PLG reports to marketing, who reports directly to the CEO. But product, engineering, marketing, and customer support all have dedicated resources that are focused on PLG.” While evolution to PLG took a while, Jay admits they “had to slow down first to go faster later.” Now PLG makes up 20%+ of Zenefits’ bookings.
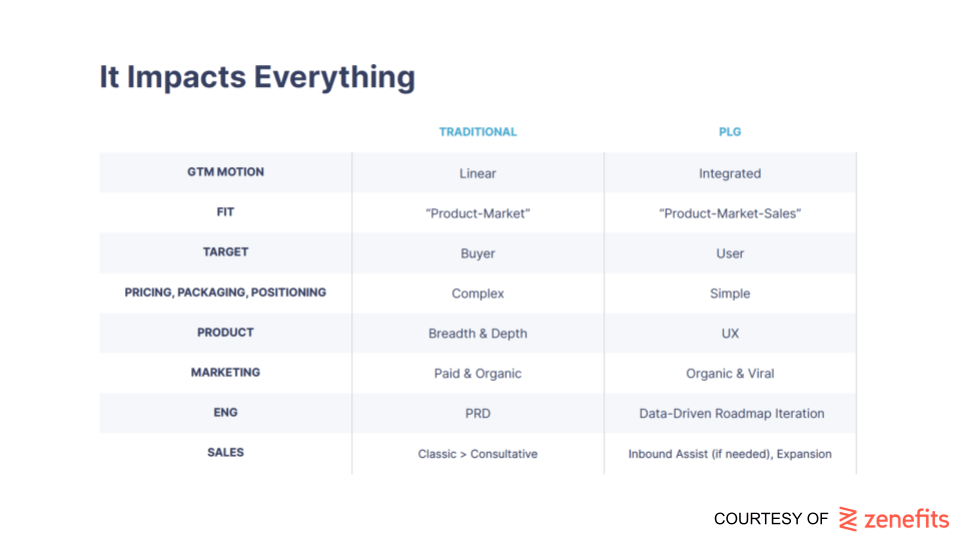
And as far as organizational culture, “it’s all about having an experimental mindset,” says Jay. “Instill in the teams that it’s okay to try and fail. The only thing that’s not okay is to not try, or to try things and not figure out why they’re working — or not working. What’s the point of running an experiment if you don’t know what produced the outcome?”
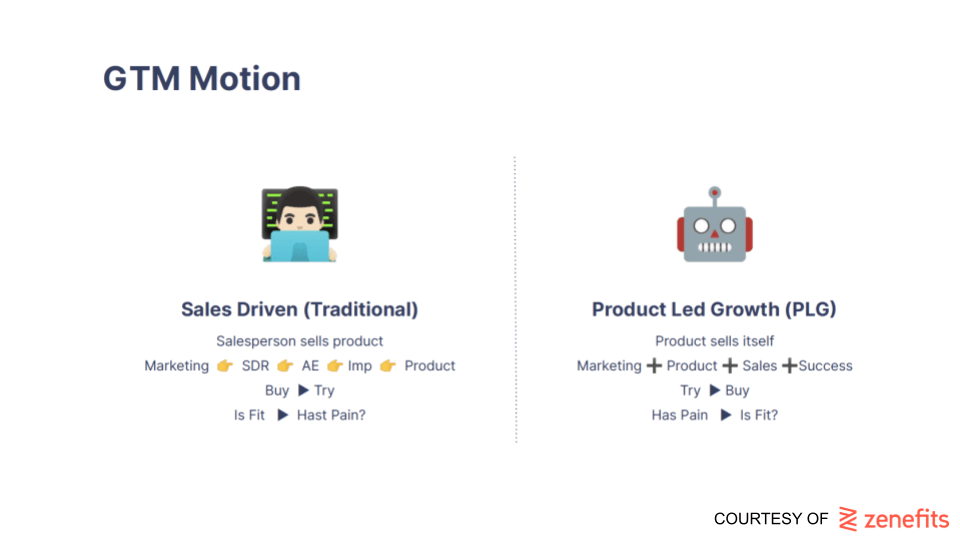
PLG: What did the CEO have to unlearn?
Change is hard, and moving to PLG requires unlearning. As a technology leader who started his career in sales, Jay knows this better than anybody. Here are his tips for what the CEO had to unlearn to implement PLG:
- Different Focus – Traditional sales teams are trained to go after the buyer; PLG is instead focused on the user first.
- You don’t know the answer; be patient and simplistic about experimentation. “In the beginning, we played around too much with pricing and packaging,” says Jay. “We got overly exuberant in the sandbox.” Think about a science experiment: you can’t have 10 dependent variables! “Isolate some dimensions to understand what is and isn’t working. Maybe two or three variables, not fifteen.”
- SLG people may not be the right people for PLG, and you may need to let go of underperforming team members. “When we introduced PLG initially, we took sales people that didn’t perform upmarket and put them in PLG,” says Jay. “And it didn’t work. Maybe it sounds like an annoying executive phrase, but it’s true: there’s no room for underperformers. You can’t just rearrange the deck chairs.”
Review: Key Takeaways
Operationalizing is easier said than done. Follow these steps to get started on the right track:
- The playbook needs an owner: the CEO. Only the CEO can own the playbook, because execution requires cross-functional alignment.
- To build your GTM model, start by deciding which department or team is in charge of every step of the playbook.
- The handoffs between teams are where things tend to get stuck or dropped. Make handoffs clear. Have an agreed-upon metric that captures the handoff.
#4 Improve the Ride: Use Metrics to Iterate on Your Playbook

Once you’ve assigned leaders and defined handoffs, leveraging the right metrics will help you to drive GTM operations by setting goals, measuring outcomes, and keep iterating. Using this data-driven approach, you can iterate on your GTM just like you iterated on your product during the search for PMF.
The good news? There’s a metric for everything. The bad news? …there’s a metric for everything. That’s why metrics are so confusing. It’s easy to get lost in the cacophony of SaaS metrics.
So which metrics to use — and how? What is a framework to structure how to think about the different metrics? How do you convert the cacophony into a harmonious symphony?
Foundation for Metrics: Variable Zoom and System View
The first thing to understand is that not all metrics are created equal. Some are more important than others, and more importantly, some metrics feed into and/or make up higher-level metrics. That’s why it’s helpful to think of metrics in a hierarchy.
Our GTM Metric Hierarchy relies on two concepts we discuss more in depth later in our second book: variable zoom and system view.
Variable zoom is all about looking at the big picture and focusing on the details, all while being able to connect the dots. If the CEO sees a problem in one of the End-to-End metrics, they must zoom in closer to look at the stage metrics and team metrics and diagnose where the real problem lies. The CEO must constantly adjust their focus like a variable-zoom camera lens.
Variable zoom works best when the CEO takes a system view. Building a system view is all about seeing how the pieces of your GTM motion fit and work together as a whole (see example graphic). Think about the GTM motion like a complicated machine, like a car. The brake pedal, brake piston, and brake pad are all important, but no one part slows the car on its own. If you tried to brake the car by using just the brake pads, you’d rear-end the SUV in front of you. Every part of the mechanism works together as part of the brake system. And when there’s a problem with your brake system, a mechanic needs to diagnose and fix the issue by looking at each constituent part one by one.
Just like individual parts of the brake system, neither sales nor marketing nor product closes a deal on their own. They work together as part of a system. And when there’s a problem with the system, the CEO needs to zoom in closer and diagnose the problem in each constituent part. The classic system view for GTM, which we will use and explore, is a more flexible version of Lead, Land, Renew, and Expand.
GTM Metric Hierarchy
The pyramid below reflects our organizing principles for metrics: the GTM Metric Hierarchy. We’ll discuss each level briefly, from the top down, before diving into more detail from the bottom up.
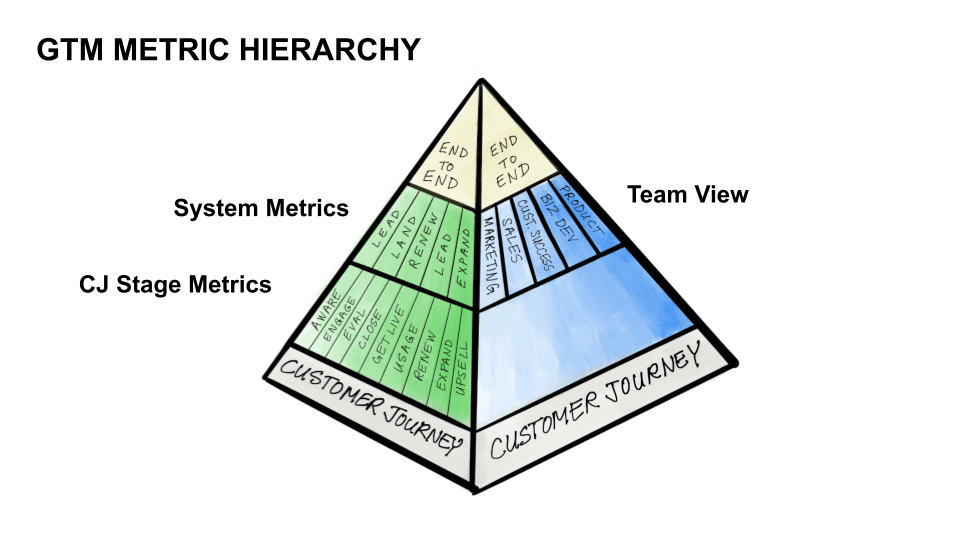
At the top of the hierarchy are the End-to-End metrics, which include LTV:CAC, Net New ARR, Magic Number and Net $ Retention. End-to-End metrics measure the performance of the entire GTM process. These metrics give you the big picture about your business, and they’re the ones investors use to evaluate you. But looking at the End-to-End metrics alone, the CEO can find the End-to-End metrics to be too high-level. You’re looking at the whole picture, but you’ve zoomed out too far to see the detail. They are backward-looking and not assignable to any one team.
One level down from the E2E metrics are the GTM system metrics. We’ve zoomed halfway between the big picture (E2E metrics) and the granular detail (the CJ). The GTM system metrics bridge the gap between End-to-End metrics and the CJ by grouping the stages of the CJ into a flexible version of the classic GTM systems: Lead, Land, Renew, and Expand/Upsell. We look at each of these systems separately in order to see how the CJ works at a higher level and identify any problem areas. Examples of system metrics include new pipe generated (Lead), CAC (Land), renewal billings (Renew), and gross $ retention (Renew). Put this way, we can see that E2E metrics are made up of the system metrics. For example, LTV:CAC is composed of LTV and CAC. LTV is affected by new bookings (Land) and renewals (Renew), while CAC is affected by S&M spend (Lead, Land) and conversion (Land). These metrics give a CEO the “health” of the components of the GTM—Lead, Land, Renew, Expand, and can be assigned or owned by a different team lead.
With this in mind, now take a look at the upper right side of the pyramid. This cross-section of the system metrics represents the “team view” of the system level. While the GTM system view is essential to understand the health of your GTM, overall system metrics alone are not enough to drive execution. Teams drive the execution of the company. And teams are each responsible for tasks at every stage of the customer journey, and consequently in each system (Lead, Land, Renew, Upsell/Expand). Once the CEO identifies a problem in the system view, they should drill down into the team metrics for each system — both for the leading team and other teams that contribute to the system. As discussed in Part 3, one team should be assigned to take the lead for every stage of the CJ. When we dive deeper into the system metrics, we will look at the metrics by team.
One level down, we zoom all the way into CJ stage metrics. These measure the performance of each stage of the GTM playbook, primarily the number of prospects in each stage and their conversion rate to the next stage. Many of the stage metrics play a role in the system view, and ultimately it is the CJ stages that make up each of the GTM “systems.” The CJ stage metrics are important for keeping track of the detailed progress of the business.
The foundation of the pyramid is the customer journey — for two reasons. First of all, the CJ is the basis of your data model, which you will use to collect information and calculate these metrics. Without a precise understanding of the CJ, there is no accurate collection and reporting of metrics. Second, and equally important, we’ve put the customer journey at the base of the pyramid to remind you not to forget where “Lead,” “Land,” “Renew,” and “Expand” come from. These systems tend to generally describe the way most CJs work in the broadest possible sense. But you need to understand the CJ stage by stage in order to run an effective operation and diagnose the kind of problems that inevitably come up. Do not pass Go. Go back to the Customer Journey.
To summarize:
- System view and variable zoom are foundational to understanding and leveraging metrics. Without them, metrics are a cacophony, not a harmonious symphony.
- In the GTM Metric Hierarchy, lower level metrics feed into and/or make up higher-level metrics.
- The basis of all metrics is your CJ data model.
- The most granular metrics are CJ stage metrics, which feed into GTM system metrics, which feed into the overall End-to-End metrics.
- We often look at system metrics by team.
- The CEO should use this hierarchy to zoom in and zoom out as appropriate. Diagnose problems at GTM system view level, then drill down to look at team metrics.
Who Cares About (Which) Metrics?
Who cares about metrics? It’s a trick question. Everyone cares about metrics — they just don’t care about the same ones. A better question is Who cares about which metrics? Understanding which metrics are relevant to which parts of the company — and how these metrics relate to one another — is the first step to cutting through the noise and creating a coherent framework.
- Board members care about E2E and GTM System Metrics. These are the metrics you’ll discuss at your board meetings: ARR Growth. CAC. Sales Efficiency. Gross Churn. Net Churn. How fast are you growing? What’s working? Where can improvements be made?
- New investors often use End-to-End Metrics as a key part of their decision to invest: the Magic Number, LTV/CAC, and Net New ARR. These big picture metrics reflect growth and growth efficiency of the startup.
- Team heads care about their Team metrics. They are less interested in System Metrics and CJ Stage Metrics, except as it might directly relate to their specific team.
- The CEO, with variable zoom, cares about all of the above metrics at different times. Deciding to scale faster or slower. Troubleshooting a roadblock in the GTM playbook. Evaluating an executive. Or raising their next round of capital.
With this perspective in mind, let’s return to the GTM Metric Hierarchy and talk in detail about each of the layers — this time from the bottom up.
Read More
Check out Tae Hea’s blog, “How to Review GTM Results at Board Meetings.”
CJ Data Model
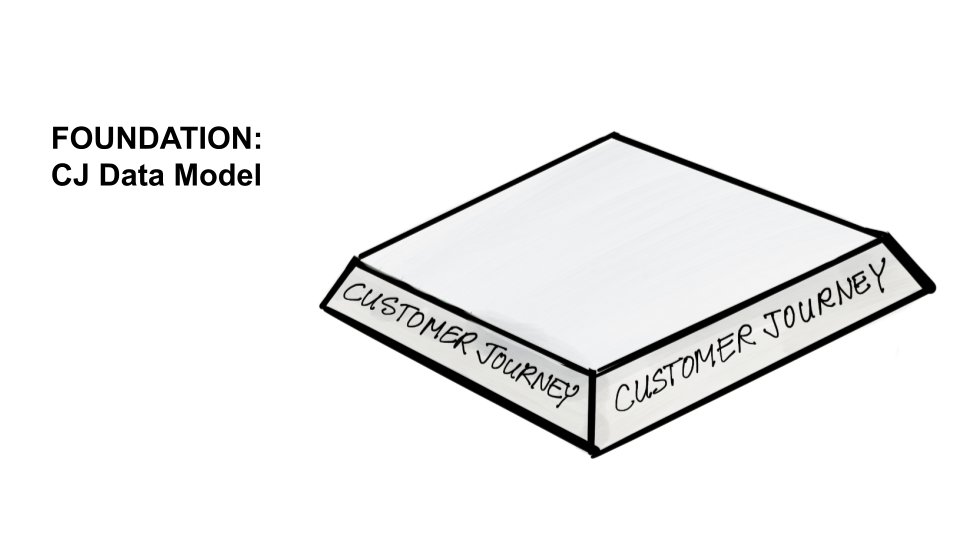
The basis of the metric hierarchy is the Customer Journey. That’s because the CJ forms the basis for your data model: the spreadsheet (or similar system) that tracks each stage of the customer journey: how many customers in each stage, for how long, and how many convert, etc. It should measure all relevant data, at all the necessary measurements points.
What are the relevant data? We recommend working backwards. Read through the rest of the metrics section and identify which metrics you need to calculate, from CJ stage metrics through system metrics and E2E metrics. Then, work backwards and determine what data you need to collect in order to make accurate, timely calculations of these metrics. Now, set up a systematic way to collect and store that data.
The accuracy of your measurements is only as good as the data you collect. Having the wrong or inconsistent GTM data model can be a nightmare. The sales metrics don’t reconcile with the marketing metrics or customer success metrics, for that matter. It’s not possible to make data-driven decisions when you don’t know if you’re looking at the right data.
Before moving on, check: is your data model consistent? Is it based on the customer journey? If not, do not pass Go, do not collect $200. Go back and build a consistent data model. If yes, you’re ready to proceed!
CJ Stage Metrics
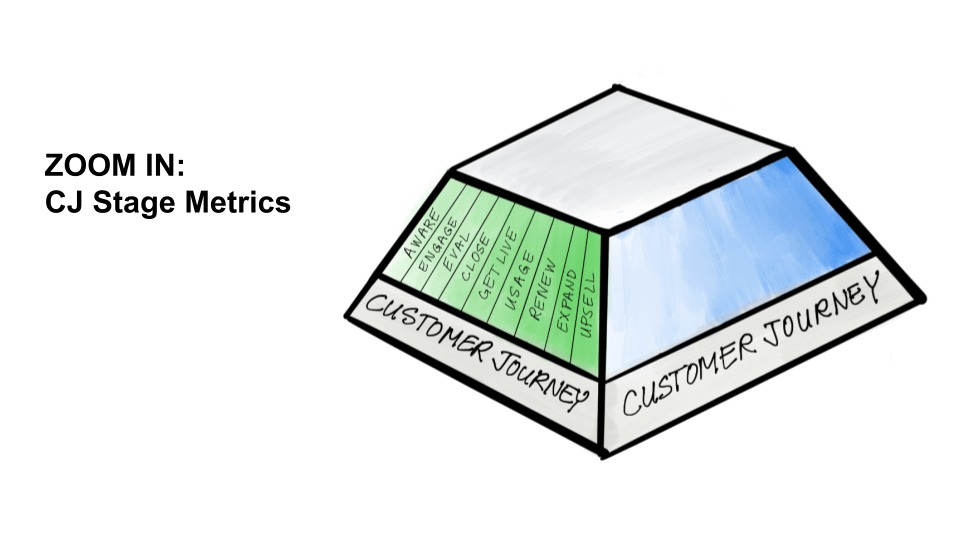
The next level of the metric hierarchy is your CJ stage metrics. When you build your playbook, each stage in the playbook becomes a measurement point.
Keeping tabs on the stage metrics is like taking the “blood pressure” along each stage of your playbook. By looking at these numbers, you can diagnose where customers are getting stuck and what is making things go faster or slower.
You can monitor the flow of your GTM motion by keeping track of:
- the number in each stage,
- the number of new customers added,
- the time spent in each stage, and
- the percent that convert (make it to the next step).
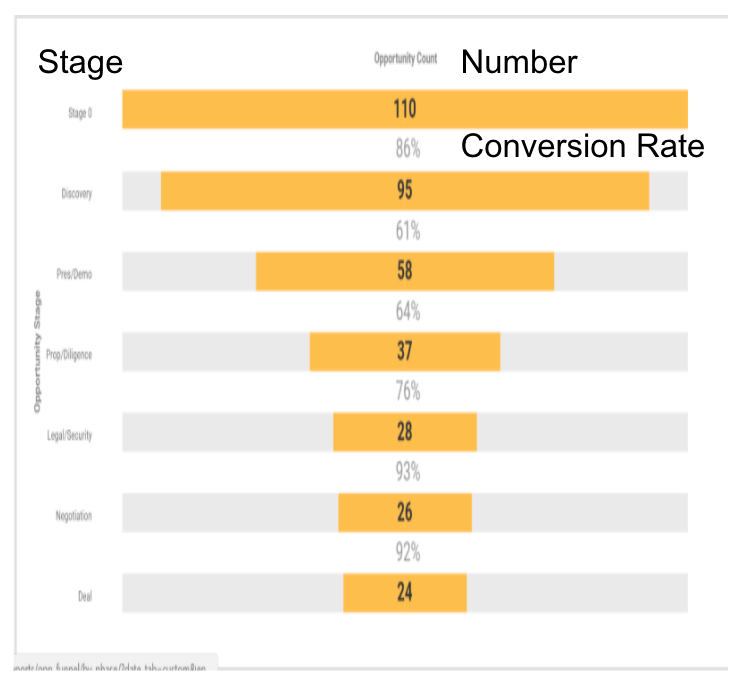
The graphic above illustrates one view of stage metrics. As customers progress (move down) to the next stage, the number of customers in the stage and the conversion rate are shown.
To learn more about CJ stage metrics, check out this post by Jacco van der Kooj, founder of Winning By Design, about the SaaS Data Model.
Analyzing CJ metrics is helpful, but it is easy to lose perspective by just focusing on the CJ stages. That’s why we group them into a GTM system view.
GTM System Metrics
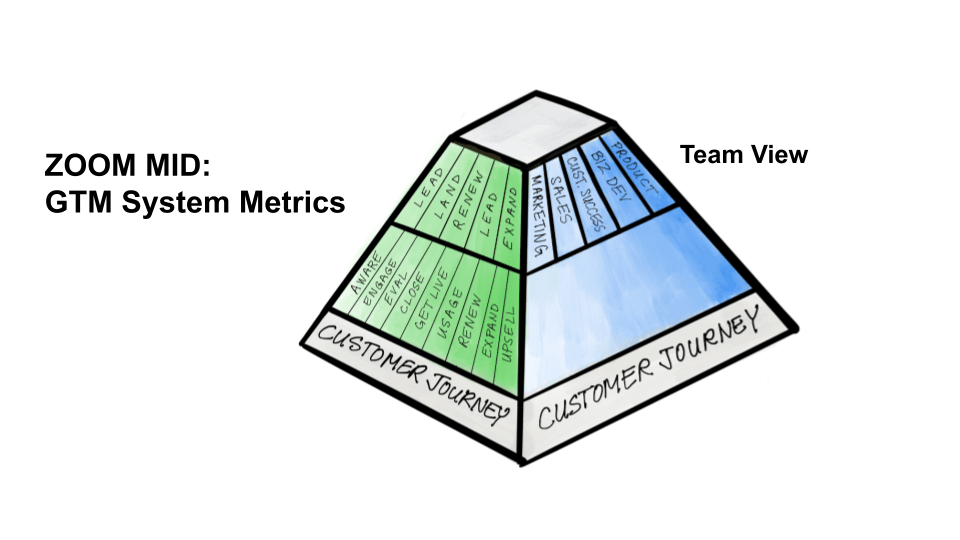
Building a system view is the key to focusing on details while keeping an eye on the big picture. The GTM system is broken into five groups: Lead (from new customers), Land, Renew, Lead (from existing customers) and Expand/Upsell. To help provide perspective, the diagram below groups the customer journey stages into the GTM system groups:
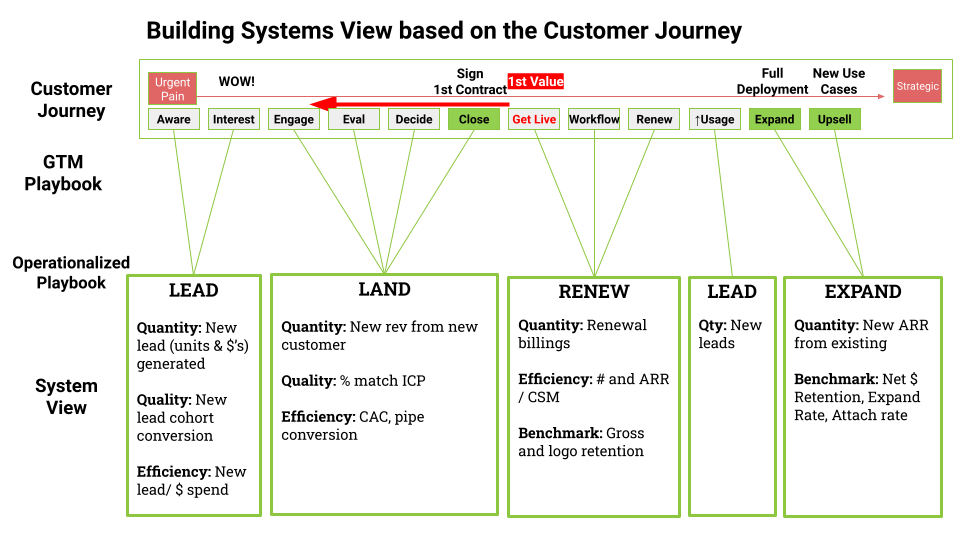
Each of the five boxes lists the system metrics for each part of the system, measuring quantity, quality, efficiency, and/or benchmarks for each part of the GTM system. Looking at the system metrics will alert the CEO to problems in a particular part of the GTM.
Your system metrics are the metrics you’re going to talk about in board meetings every quarter. They’re the metrics that show progress at key points in your GTM and help explain the end to end metrics.
Connecting the Overall GTM System Metrics to the Team Metrics
If the GTM system metrics help the CEO identify a problem in a particular part of the system, the team metrics in each part of the system help the CEO drill down, diagnose the problem, and make an operational plan to fix it. Remember this workflow: first look by system, and then by team.
The diagrams below tie the GTM system metrics with the teams. Just like the metric hierarchy pyramid, it’s organized by system and by team. Your GTM model — whether it be Sales Led Growth, Product Led Growth, or a hybrid — drives the organization of these systems, and consequently which teams take the lead during each step. We will discuss three different variations.
Sales-Led Growth (SLG) System Metrics
The chart below visualizes the overall System Metrics and accompanying Team Metrics for a SLG model.
The first row (“System View”) lists the key overall metrics for each GTM system group, in terms of quantity, quality, and efficiency. Please note that “New Leads” are renamed as “New Pipeline” in SLG. Pipeline is the preferred term because sales works on pipeline, and not leads. Take, for example, the “LEADS for New” system. New pipe generated measures the quantity of prospects in the system. New pipe conversion by cohort measures the quality — whether the prospects are a good fit. New pipe over spend measures the efficiency of this system.
Now look at the green row below (“OWNERSHIP”). Each system group is owned by a team, listed to the right. In a SLG model, marketing typically takes the lead for Leads (New). Then, sales takes the lead for Land. Customer Success takes over for Renew, and generates Leads (Existing). Then CS and/or Sales takes the lead for Expand and Upsell.
Below this column, we’ve listed specific team metrics that are relevant for each system, with the leading team in green. These team metrics are useful not only to department heads but to the CEO when diagnosing and fixing problems. For example, imagine the CEO identifies a problem in the Renew system; the company is not meeting targets for renewal billings. The CEO then looks at the metrics for individual teams, CS and Product. In the support tickets, the CEO notices a specific recurring issue that must be solved. Now, we know where to focus in order to fix the problem in the Renew system.
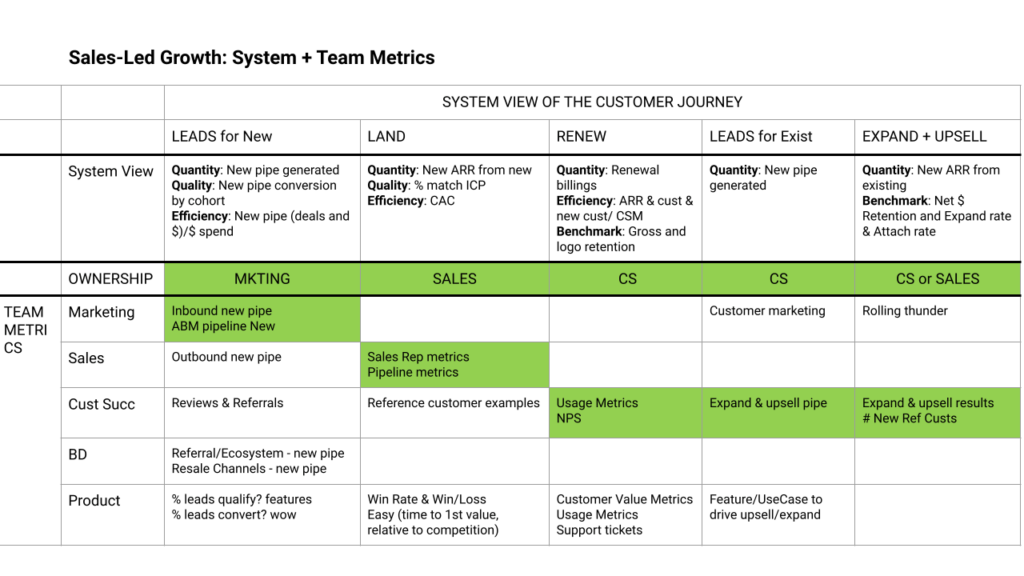
Because of the importance of the sales team in a SLG model, we have provided more detail on the sales team metrics:
Overall sales results
- $ New ARR closed
- # New customer wins
Sales rep metrics
- Average Rep $ – New $ARR / # reps
- Average Rep # Deals – # deals / # reps
- % Quota Achievement – Actual new ARR / Quota
- % Rep Achievement – # reps make quota / # of reps(lots of reps success or hero selling?)
- Ramp Time – how long to be at full quota?
- Ramped Reps – # ramped vs un-ramped reps
- Target Quota / sales rep — the target for the financial model. This is a key model assumption.
- Quota Capacity – # reps x Quota
- Quota Coverage Ratio – Quota Capacity/Sales Target(<100% implies the Target is unreasonable. > 120% implies inefficient sales).
- Quota Efficiency – Quota / sales expense costs. — is the quota target economically viable?
Pipeline metrics
- Starting Pipeline – $ and # at beginning of quarter
- New Pipeline – $ and # generated in the quarter
- Conversion rate – % of opportunities won
- Conversion time – # days Opportunity to Close
Sales efficiency metrics
- Sales Efficiency – Actual $ ARR / Sales&Marketing Costs — is the business economically viable?
Competition
- Win Rate
Sales quality
- % wins = customer ICP
Product-Led Growth (PLG) System Metrics
The chart below visualizes the overall System Metrics and accompanying Team Metrics for a PLG model. As before, GTM system metrics reflect the health of each part of the GTM. One key difference is that “new leads” in the PLG model are new free active users.
Now, instead of sales taking the lead in the Land group, product and/or marketing are now in charge for the rest of the customer journey. Once a new free active user engages with the product, it’s the job of marketing and product to drive freemium usage and ultimately conversion. Product and team metrics give insight into what features drive usage and lead to faster conversions.
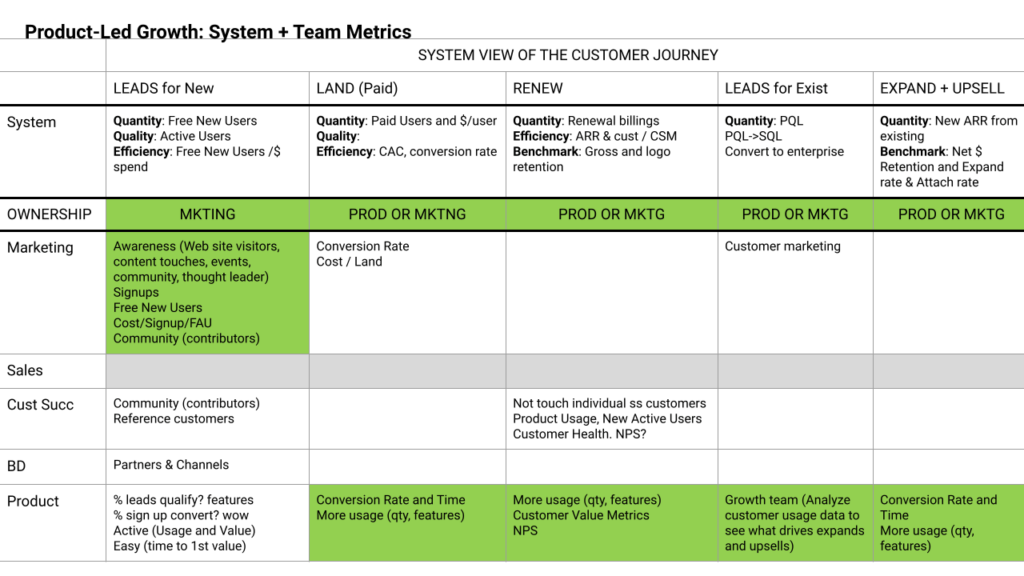
Because of the importance of the product team in a PLG model, we have provided more detail on the product team. Here are some core questions for your product team to tune up your GTM:
Activation
- How to measure activation? # New free active users
- Time to active (first value)
- All the funnel metrics (views, signups, conversion, efficiency, source etc)
- What Wow’s in the product that solves the urgent pain?
Customer Usage and Value
- How to measure usage?
- What makes users more active? Measure active (DAU/MAU), Key usage metric, key feature or report
- How to measure value?
- What creates value for the active user?
- What in the product minimizes churn?
- What drives more users?
Paid Conversion
- How to measure conversion from free to paid? How long? What percentage?
- What drives conversion? Specific feature, use case, urgent pain?
Expand
- How to the measure expands? Net Usage retention
- What triggers expands?
- What is the capability in the product that makes the customer a hero?
- NPS
Financial
- Net Dollar retention
- CAC and LTV:CAC
Amit Bendov, Founder and CEO of Gong.io, has a great metaphor for how making your product easier can speed up GTM:
“Here’s a free tip for founders/CEOs that aren’t thrilled with their sales. Think of your product as a knife: if the edge is dull, your sales team will need to apply more pressure. If the edge is razor sharp, it’ll easily slice through the market. Make it easier for your sales team — the ROI is huge.”
Amit Bendov, Founder and CEO of Gong.io
PLG/SLG Hybrid System Metrics
As Zenefits CEO Jay Fulcher advised: if you can land with PLG, you should. But to sell upmarket and/or get upsells, it’s still useful to hire a sales team. In this model, sales takes the lead for the last part of the GTM system. Based on usage metrics, the product team can identify which customers to send to sales for expands and upsells.
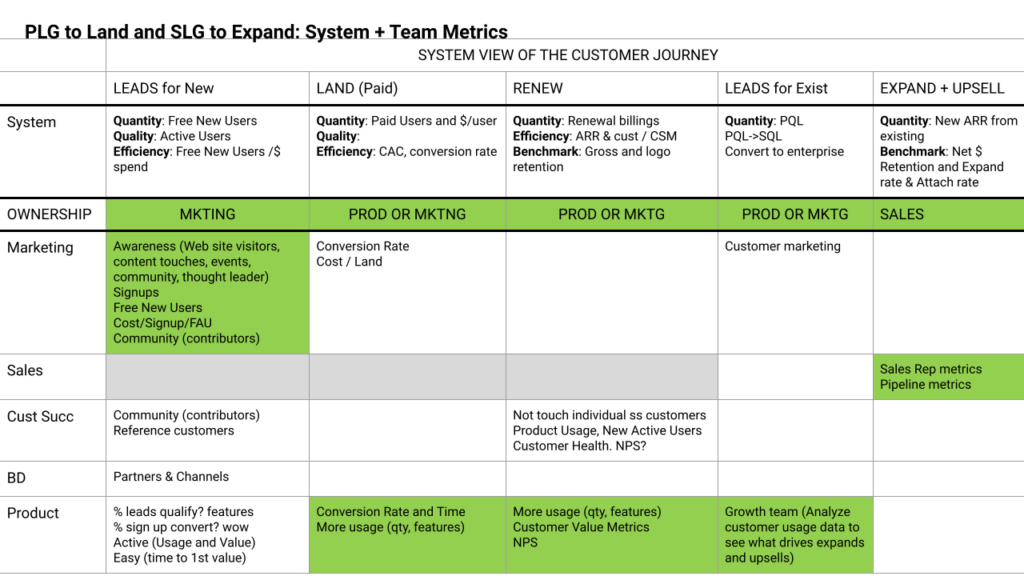
Example: Applying System and Team Views
Enough theory! On to a practical example. Recall the methodology: to identify a problem, we use system view. Then, we drill down into team metrics to diagnose the problem and devise an actionable solution plan.
By using system view, we identify a gap in the GTM system: miss New ARR from new customers (i.e., the Land part of the GTM System). Where is this new ARR miss coming from? And how to fix it?
To further diagnose the problem, we drill down to lower-level metrics for each team involved in Lead & Land.
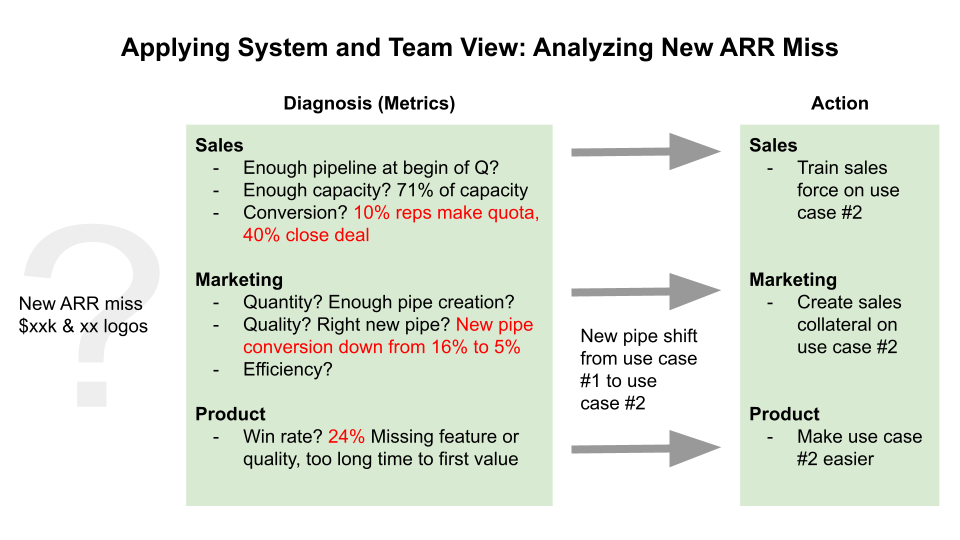
Sales
- Is there enough pipeline?
- Is there enough capacity?
- Is conversion working?
- sales rep productivity, playbook, deal management, leadership
Marketing
- Is there enough pipe creation?
- Is it the right new pipe (look at conversion)?
- Is new pipe creation cost effective?
Product
- What is the win rate?
- missing feature, quality issues, too long time to first value
In sales, we notice the team is operating at 71% of capacity, but only 10% of reps are making their quota, while 40% close their deals. So capacity is not the problem — it’s something about the prospects in the pipeline. And in fact, in marketing, new pipe conversion is down 16% to 5%. By dissecting lost deals, we realize that prospects in new pipeline are looking for a different use case not yet fully supported by the product. Usually, the long term answer to every GTM issue is a product solution. To rectify the problem, we rally sales, marketing, and product around Use Case #2.
GTM Tip
Picking a “Rally Metric”
Not every metric can be focused on at once. Picking a “rally metric” can be a really powerful way to marshall different teams together and crack a bottleneck when customers are getting stuck at a particular point of the playbook. This allows the team to focus, crack the bottleneck, improve the overall flow through the GTM playbook—and then move on to the next bottleneck. Because this requires cross-functional coordination, picking the rally metric often can only be done if the CEO owns the playbook. Here are a few example rally metrics tied to key points in the customer journey milestones:
– Trial Capacity: # of Trials/Sales Engineer
– Trial Time: time spent in trial before becoming an opportunityTT1V “Time to 1st Value”: what triggers 1st value? How long to get there?
– TTO “Time to Onboard”: How long from Win to customer active with product?
End-to-End Metrics
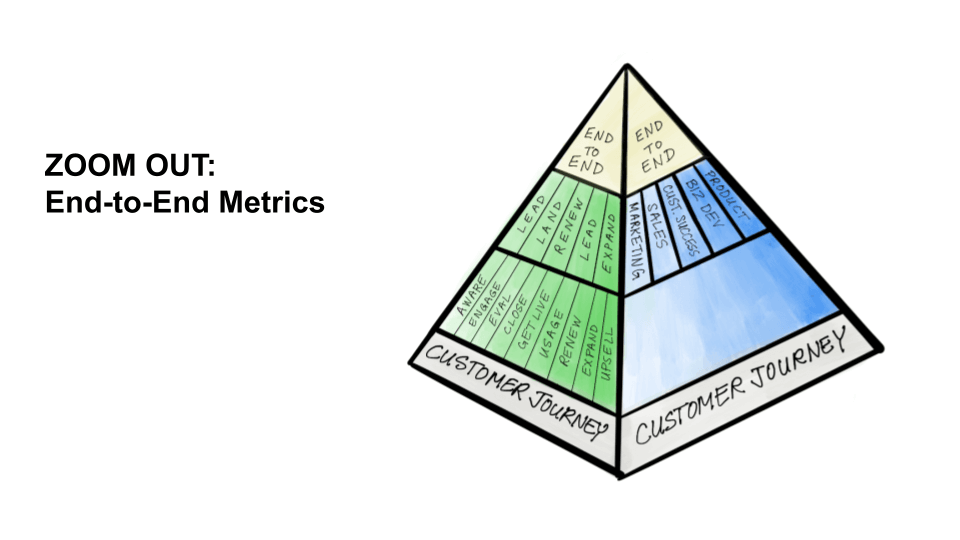
The End-to-End SaaS metrics give you the big picture about your Go-To-Market, and they’re main criteria when investors evaluate your Go-To-Market:
- Net New ARR. How much ARR has increased/decreased from the period? It is the sum of all new ARR (such as lands, expands and upsells) minus the sum of all lost ARR (such as churn or contraction). In other words, how much are you growing?
- Magic Number. For every dollar spent on sales and marketing, how much new revenue did you generate? In other words, how efficient is your Lead and Land system? If this number is greater than one, things are going well.
- Net Retention. How much is your business growing from your existing customer base? Net retention increases with expands/upsells and decreases with churn. If your net retention is over 1, the company will still grow — even without new customers.
The End-to-End SaaS GTM metrics are lagging indicators, and it may take you a few quarters to see a positive result. They are the outcome of the GTM process — not tools to improve it. That’s why it’s important to remember: to tune up the playbook into a well-oiled machine, you need to look under the hood.
Have You Found GTM Fit?
Here’s how you’ll know you’ve achieved GTM Fit. You’ll see it in the numbers. And you’ll just feel it.
End-to-End Metrics: Growth and Efficiency
Here’s how you’ll know you’ve achieved GTM Fit. You’ll see it in the numbers. And you’ll just feel it.
Analytically, the Magic Number measures your Go-to-Market Fit. Your Magic Number (new ARR divided by your marketing and sales spend) answers the question, how much do you grow for every dollar spent on S&M? If every dollar of S&M spend brings in more than one dollar of revenue, you’ve achieved GTM Fit. But keep in mind that the magic number is a lagging indicator, and it may take you a few quarters to see a positive result.
What Does GTM Fit Feel Like?
Enough of the GTM Fit analytics. You’ll know you’ve cracked your playbook because you’ll feel it. It feels like surfing with momentum. What does the lack of GTM Fit feel like? Paddling around in the water with no momentum. Signs of GTM Fit, or the lack of it, come from across the business. Here are some of the good and the bad:
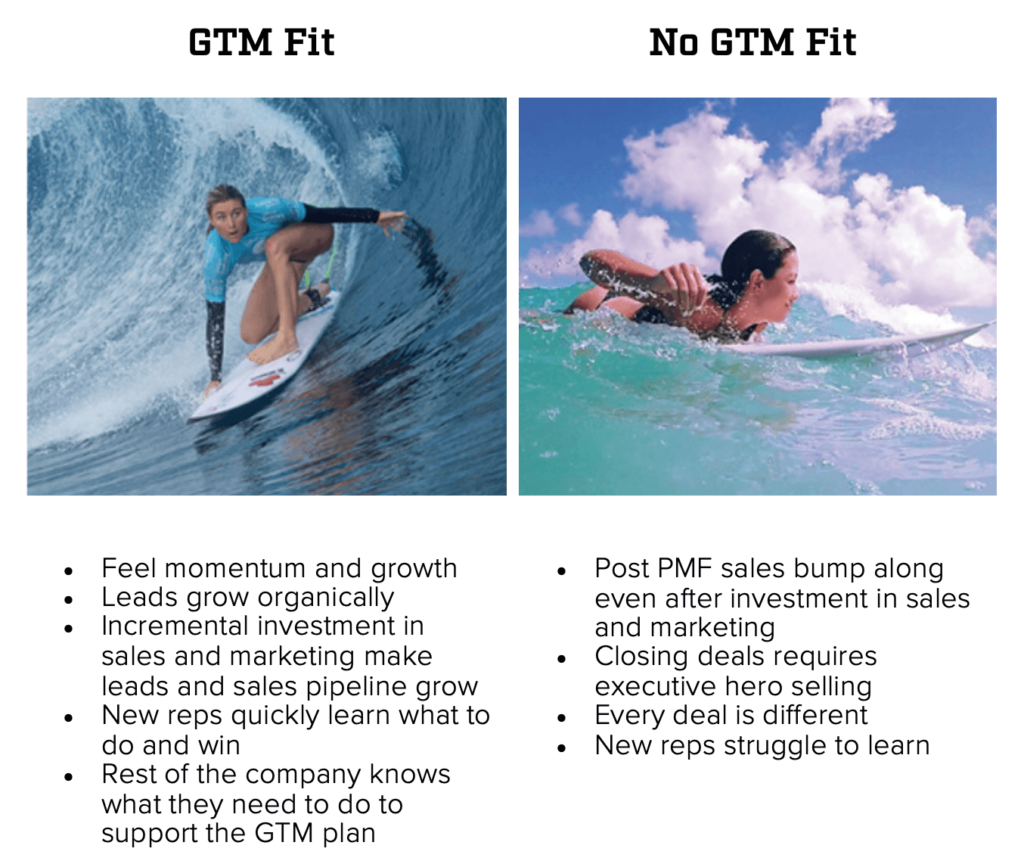
The GTM Cheat Sheet
After making it through this chapter, we thought it would be helpful to put every part of the GTM Playbook onto one slide — the “GTM Cheat Sheet.” This slide is your roadmap for every part of building and executing the playbook. It’s daunting, yes, but not nearly as daunting as it was without a map!
Download the cheat sheet as a PDF here:
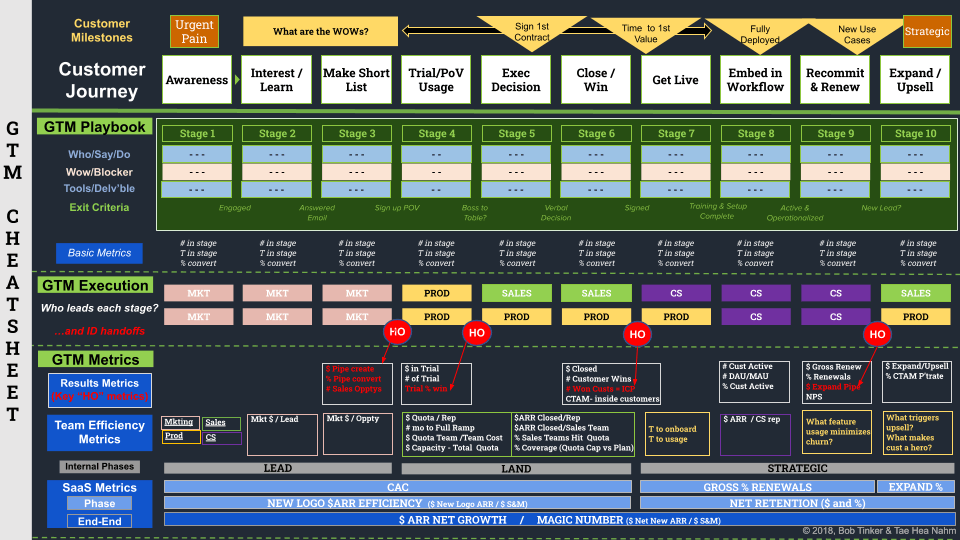
What if GTM Fit Feels Elusive?
Sometimes a company just falls into GTM Fit. Purchase orders are emailed in with minimal effort. The company can’t follow up on most of the leads it gets, and deals are easy to close. But that’s not common. Most companies struggle, iterating through trial and error to find GTM fit.
When GTM Fit eludes a company, one of two things is usually going on:
- Playbook problem. Lack of repeatable playbook that nails one use case with enough urgency to drive leads and catalyze purchases now.
- People problem. Different parts of the organization are not lined up on what’s in the playbook, often due to past inertia or differing interpretations of the playbook.
Playbook Problem
When the use case and problem don’t create a sense of urgency, and instead just feel “nice to have,” that’s a problem. It needs to be fixed. Start with the customers you have won. What made them act or what cause them to get stalled? Is there a consistent profile for customers who found the use case urgent? Does that profile naturally exclude the lost deals and uninterested customers? If so, that’s a clue to the ideal customer profile.
It’s also possible that the problem is urgent but you haven’t found the “Wow!”: that key metric, feature, or report that captures the attention of buyers and drives them to buy your solution rather than the competition’s. Get inside the head of the user and the buyer: What makes the buyer a hero? What are they scared of? What do they aspire to? What pain is solved?
How do you find the patterns? Identify the ideal customer profile? Find the pain? Tease out the “Wow!”? Your customers, prospects, sales and customer success teams will tell you. Every win, loss, stuck deal, or uninterested customer is the world teaching you. The key: move from anecdotes “to analysis and visualization. It can be a very powerful exercise to bring together and look for patterns in the who, why, and why nots, and then make them visual.
Above all, learn from the happy and successful customers who are using your product and understand its value. Also learn from customers who got stuck or said no. Both sets of customers are the flywheel that drive the development of Playbook 1.0, line up the leadership team behind the playbook, and create GTM Fit to unlock growth.
People Problem
If you have a problem aligning your teams cross-functionally, go back to section #3: Operationalize the Playbook, and particularly Challenges with Handoffs.
Down the Road: Changing the Playbook
As a rule of thumb, you need to nail at least one GTM playbook to unlock growth. But when should you change the playbook? When should you add a new one?
The playbook isn’t the Bible. It’s not static, and it’s best to tweak it as you learn from customers. But don’t take this advice too far! The playbook should not change daily. Nor should there be more than one playbook. At the early stages of the company, building multiple playbooks will confuse your team and spread resources too thin. Once you’ve successfully scaled one playbook, you’ve earned the right to add more.
As you enter your next act as a business, you’ll need to add new GTM playbooks for new markets or new ICPs. The playbook might need to change because of market disruption — like the upheaval recently caused by the COVID-19 pandemic. Whatever the circumstances, creating a new playbook means going through these three steps again. Don’t jam new things through existing playbooks!
“Once the playbook gets going, making changes is much harder than you think. Muscle memory is what makes the GTM Playbook work so well — but it’s also what makes it so hard to change. Real change takes three steps: 1) realization that it’s hard, 2) brute force shock therapy, 3) and intense repetition.
When we changed the playbook at MobileIron, I thought we could just give new directions to our teams and press play. But after a couple months, people just went back to what they were doing before! To make the permanent change, I decided to do something extreme. I took three weeks out of my schedule and asked every sales rep to come and give me the new sales pitch to me individually. Talk about intense. Unfortunately, we had to let a few people go because they didn’t get serious about the new playbook. But in the process we also identified some incredible young talent!”
-Bob
GTM Fit: Exit Survival Mode. Get Ready for Thrival.
Achieving GTM Fit is a big deal! The startup now has a product with multiple paying customers who refer their colleagues, as well as a repeatable sales and marketing playbook that finds and wins customers with a sense of urgency. The startup has earned the right to no longer be in survival mode. The startup no longer needs to fear imminent death. With GTM Fit, it’s time to shift gears into Thrival mode, drive growth and GTM Acceleration. Very few companies ever make it this far. Getting here is a huge accomplishment. Stop and enjoy the moment!
Financial Plan for Post-GTM Fit
The team believes the company has found GTM Fit and wants to start scaling. The CEO wants to aggressively accelerate growth and become that category leader. That means raise a lot of money, hire a lot of people, and accelerate growth. But there’s a roadblock: in order to scale, the startup must raise money from investors.
At this point, many founders get frustrated. Investors just don’t seem to get it. “My business is great,” founders think. “And growth is accelerating!” But while investors may believe in the founder’s vision and be impressed by the founder’s accomplishments, they want to know the answer to the question: Am I gonna make money? In other words, will the company’s valuation increase significantly?
The answer to this question requires the founder to complete the finance growth circle.
Completing the Finance Growth Circle
Every CEO wants to run a high-growth company. Thus far, we’ve talked about how to create a repeatable GTM playbook to unlock growth. But that’s only one part of the picture. The CEO also needs a financial model to make plans and fund each round of growth.
And this plan is not “set it and forget it.” Once the model is created and targets are set, the CEO needs to monitor the downstream effects and adjust accordingly in order to stay on track, i.e. meet and hopefully beat the forecasts from the financial model. We call this process completing the finance growth circle (see diagram below).
If the CEO neglects the finance growth circle, it’s game over. The company will run out of cash. So it’s critical for the CEO to complete the finance growth circle and stay on track. Without it, all the work you did on the GTM Playbook will be for naught!
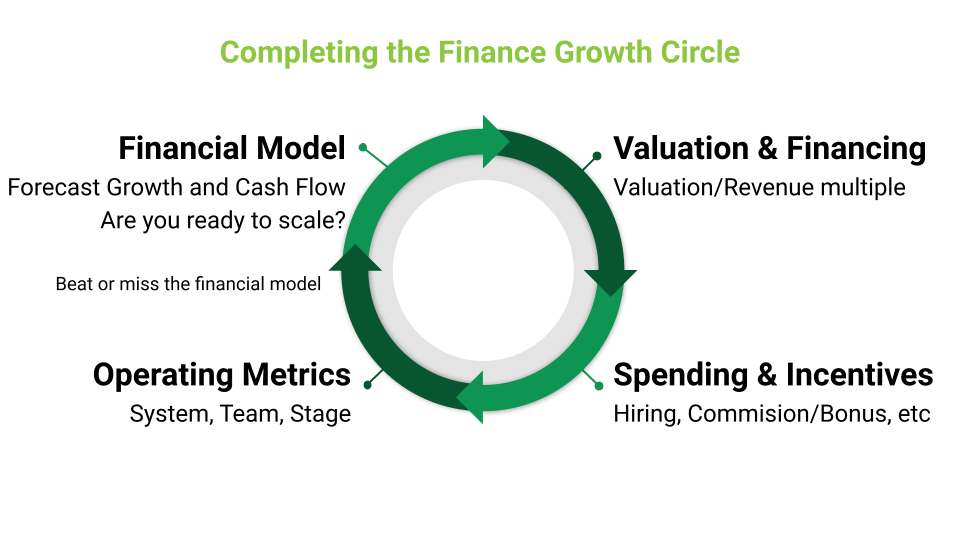
One trip around the finance growth circle represents one round of growth (and usually, funding). It starts with the CEO’s financial model, which affects valuation and financing the next round, spending according to the model, and reviewing the operating metrics. These downstream decisions determine how the company’s performance measures up against the model. At the end of the round, the company either beats or misses the financial model. Meet or beat the model, and you’re on to the next revolution around the circle. Miss the model, and it’s tough.
Let’s walk through each part step by step.
Financial Model. The starting point is the financial model. The financial model answers a fundamental GTM question: are you ready to scale from a financial perspective? Clearly, if the answer is no, the company is not ready to scale. But if the answer is yes, the model will tell you what that growth will look like. The financial model forecasts growth and cash flow. More specifically, it helps answer the questions: how fast will the company grow, and how much cash will the company burn? Most companies will burn cash to grow, and thus forecasting cash flow and growth are also critical to the next step: closing a round of financing. Investors want to know how much cash is required for the company to achieve cash flow break even.
Valuation. Many CEOs complain their valuation is too low. But where does valuation come from? It’s not as mysterious as people think. In fact, investors can determine the company’s valuation with a simple valuation/revenue multiple based on the growth and cash burn forecasts from the financial model. Investors can also determine the reasonableness of the financial model by comparing the key metrics underlying the model to the same metrics from comparable companies. If they see a magic number of 10, they’ll know that the company’s numbers are too good to be true, or that the CEO miscalculated. Punchline: to obtain a good valuation, the CEO needs a solid financial model.
Financing. How much can the company raise at this valuation? Future value depends not just on revenue, but on revenue growth. If the financial model predicts valuation significantly growing every year (and the investors believe in the financial model), the company’s financeability increases significantly too. For example, investors will put more money into companies whose revenues are growing on the “triple, triple, double, double, double” plan, as explained by Neeraj from Battery. Again, without a financial model, the company misses an opportunity for more financing.
Spending Decisions. Once the company has raised the financing at its desired valuation based on the financial model, the CEO will invest the money according to the financial model to drive growth by hiring new employees, setting up a bonus plan, new marketing programs, etc. Once again, it’s critical here that these decisions be based on the forecasts and targets set in the model.
Incentives for Management. The executive bonuses should be tied to the financial model and not just what the executives believe is reasonable.
Operating Metrics. Operating metrics help the CEO evaluate whether the company is meeting the goals and assumptions of the financial model. For an in-depth discussion of operating metrics, see Section 4 of the previous chapter. The point here is that these metrics should be used to evaluate whether the company is on track to beat or miss the forecasts in the financial model.
Closing the Finance Growth Circle. We’ve closed the loop and are back to where we started. If the company exceeds the financial plan, the company has closed the finance growth circle and is ready for the next round of growth. If the company misses the financial plan, the company generally regroups and revises its financial plan downward. But, this downward revision may make it difficult for the company to raise its next financing round.
It may sound like a lot of repetition, but we can’t emphasize it enough: the CEO must create a financial model and track against it to complete each round of growth. Completing the finance growth circle helps the CEO connect the dots and understand how each choice you make impacts the business down the line.
If you … invest a dollar more in sales and marketing,
… invest a dollar more in R&D,
… pick a “rally metric” to focus the team,
… pump the breaks on GTM spending,
… hire two new salespeople,
How does it impact cash flow?
How does it affect future valuation?
How does it impact future ability to raise money?
Complete the finance growth circle and think through all the implications. If you don’t complete the circle, you might go off a cliff.
Section Outline
This chapter will take you on a trip around the finance growth circle.
We’ll begin by explaining how you can build the simplest possible financial model, using three metrics you can easily calculate on a napkin. The model helps answer the question Are you ready to scale from a financial perspective? We’ll extend the model to show you how to forecast growth and cash flow.
Next, we’ll provide some intuition on how to determine your valuation based on the outputs of the financial model.
Finally, we’ll give you some tools to guide spending decisions and make sense of operating metrics.
At the end of the chapter, there’s an appendix section with more detail about how to build the financial model.
Build a Simple Financial Model with Just 3 Metrics
Using only three key metrics, you can build the Storm SaaS financial model and answer the question: are you ready to scale?
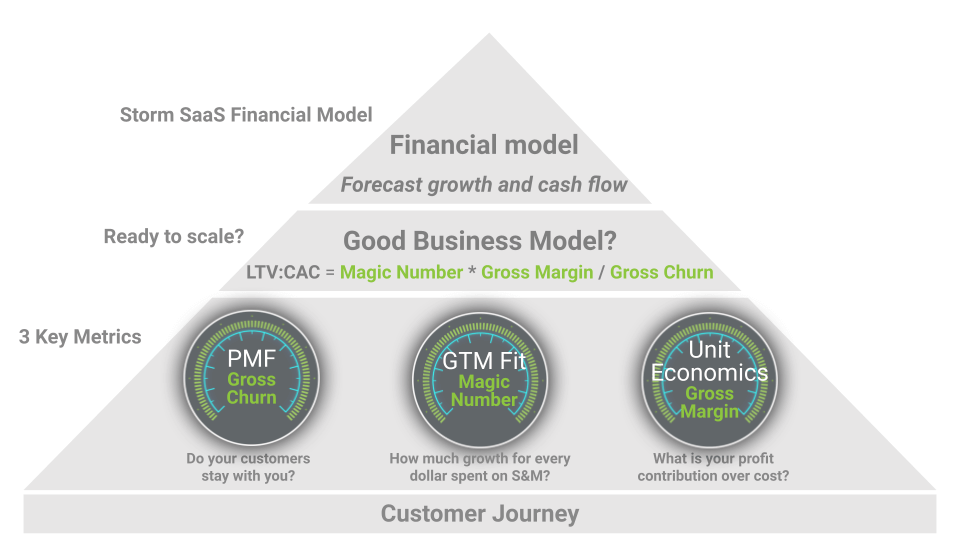
The simple financial model can forecast growth and cash burn with only three key metrics: Gross Churn Rate (which measures Product Market Fit), Magic Number (which measures GTM Fit) and Gross Margin (which measures Unit Economics).
With this simple financial model, the CEO can model different “what if” scenarios for different spending plans. For instance, what would be the future growth (i.e. future ARR) and cash flow (i.e. future zero cash date) for each spending scenario? Since investors focus on growth rate and capital efficiency, the model also helps answer the question: Which scenario is most desirable for new investors? or the related question, Is this scenario fundable?
If you’d like to build and use the model yourself, there’s more information on that in the chapter appendix.
But first things first, let’s tackle the most important question: Are you ready to scale? We’ll explain a straightforward answer, using numbers you can easily calculate on a napkin.
Are You Ready to Scale?
With just three metrics — gross churn rate, magic number, and gross margin — you can measure the health and profitability of your business. By combining them into a simple equation, you can get your LTV:CAC (Long Term Customer Value to Customer Acquisition Cost), a measure of your business’s long term financial outlook. If the 3 key metrics are the Elven Rings, LTV:CAC is the One Metric to Rule Them All. If the LTV: CAC is over 3, you’re ready to scale.
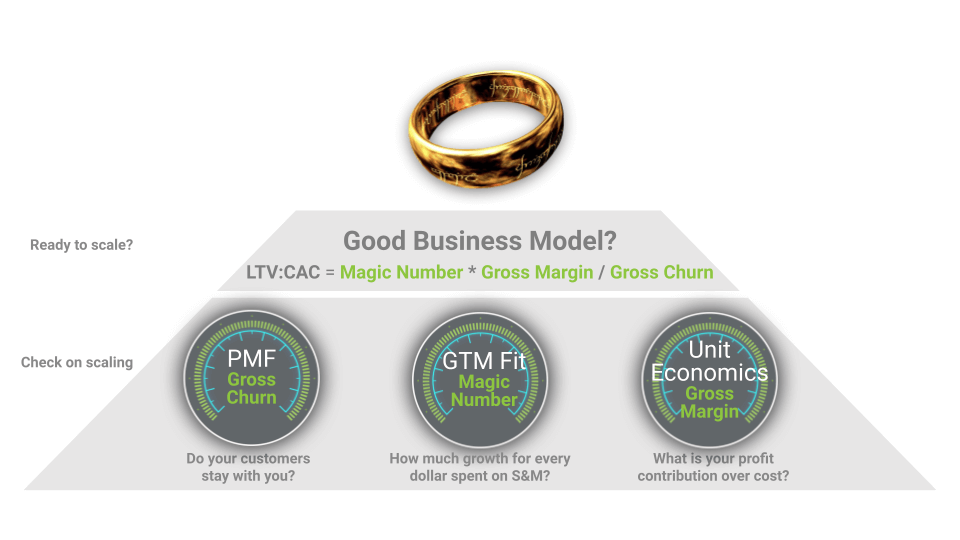
The Three Key Metrics: The Elven Rings
Let’s unpack the three key metrics:
1. Gross Churn Rate (GCR) measures your Product-Market Fit (PMF). GCR is the % of recurring revenue lost from customers that didn’t renew. It answers the question, Do your customers stay with you? If your customers don’t stick with you, you haven’t found PMF.
CGR = Lost Monthly Recurring Revenue / Total MRR
Example
At the beginning of the month of March, the company brought in $60,000 in MRR. By the end of the month, $15,000 worth of contracts didn’t renew.
CGR = $15,000 / $60,000 = 0.25, or 25% CGR
2. The Magic Number (MN) measures your Go-to-Market Fit. You can calculate the Magic Number by taking New ARR divided by your marketing and sales spending. This metric answers the question, how much new revenue is generated for every dollar spent on S&M? If every dollar of S&M spend brings in more than one dollar of revenue for a recurring business, you’re in good shape. But keep in mind that the magic number is a lagging indicator, and it may take you a few quarters to see a positive result.
MN = New ARR / S&M
Example
In March, the company spent $25,000 on sales and marketing and generated $65,000 in New ARR.
MN = $65,000 / $25,000 = 2.6
Growth is your new revenue (based on MN) minus churned revenue (based on GCR).
3. Gross Margin (GM) measures your unit economics. It’s equal to net revenue as a percentage of total revenue. GM answers the question, How much gross profit do you get over the cost to produce each unit sold?
GM = (Revenue – COGS) / Revenue
Example
In March, the company sold $170,000 worth of services, for a cost of $85,000.
GM = ($170,000 – $85,000) / $170,000 = 0.5, or 50%
LTV:CAC – The One Ring to Rule Them All
If your Gross Churn, Magic Number, and Gross Margin are the three elven rings, your LTV:CAC is the One Ring to Rule Them All. Your LTV:CAC answers the question, Do you have a financially sustainable business?
You can derive your LTV:CAC with a simple equation, using just the three metrics above:
LTV:CAC = (Magic Number x Gross Margin) / Gross Churn Rate
As a general rule, if your LTV:CAC is at least 3, you’re in good financial shape to hit the gas and grow your business.
Example
In the exercises above, we calculated the following metrics for the company’s performance in March.
GCR = 0.25
MN = 2.6
GM = 0.5
So, that means our LTV:CAC is the following:
LTV:CAC = (2.6 x 0.5) / 0.25 = 5.2
That’s higher than 3, which means this business is ready to hit the gas and scale up.
At this point, it’s natural to ask: what values of GCR, MN, and GM should you target in order to achieve LTV:CAC > 3? The answer is that it depends on the business.
The table below shows different magic number and gross churn rate combinations that would generate a CLV:CAC ratio of 3 for a 50% to 80% gross margin business. As expected, a high gross churn requires a very efficient go-to-market (high magic number) to make the business viable.
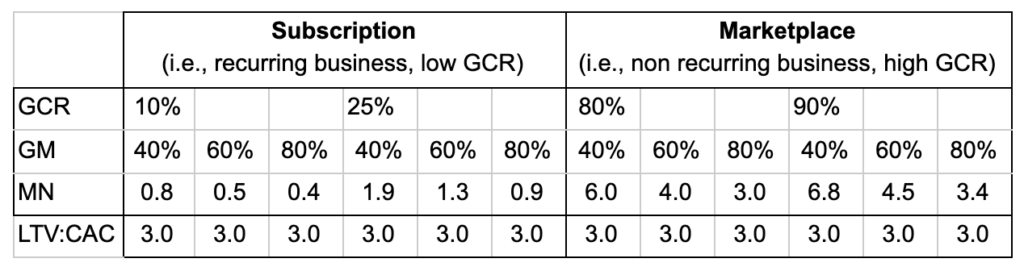
Since a good subscription-based business has a low GCR (say, 0.1), renewals can subsidize a smaller magic number. In a SaaS business, the magic number doesn’t need to be quite so high.
In a marketplace business with no renewals, the gross churn is close or equal to one, and the magic number must be much higher. In this case, you need a magic number ten times higher than the SaaS business to maintain an LTV:CAC of 3!
Forecast Growth with Magic Number and Gross Churn Rate
Net New ARR is the ultimate metric for measuring growth of a SaaS business. By forecasting future ARR, the simple financial model also forecasts Net New ARR, which is New ARR – Prior ARR.
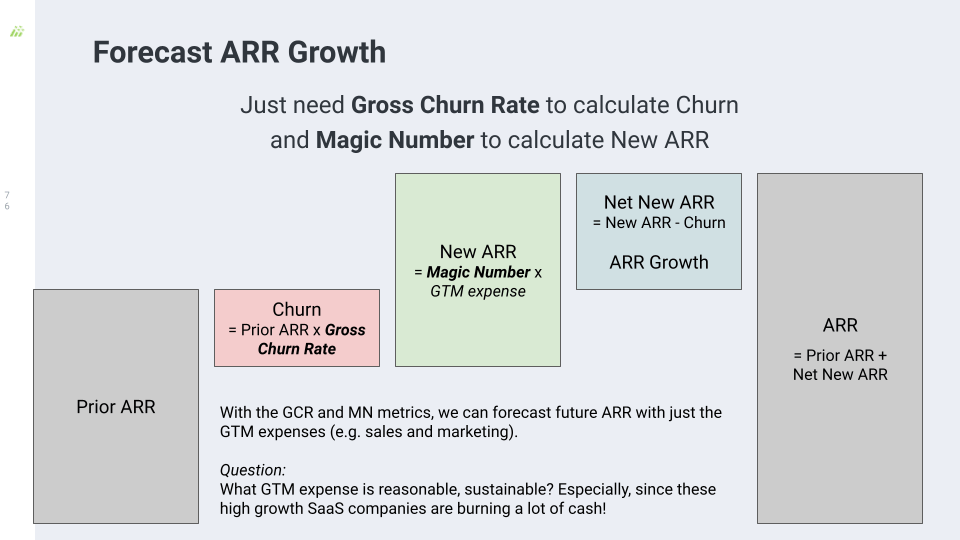
Next year’s ARR is simply the current year’s ARR, plus new ARR closed next year, minus new ARR churned next year. Or, written mathematically:
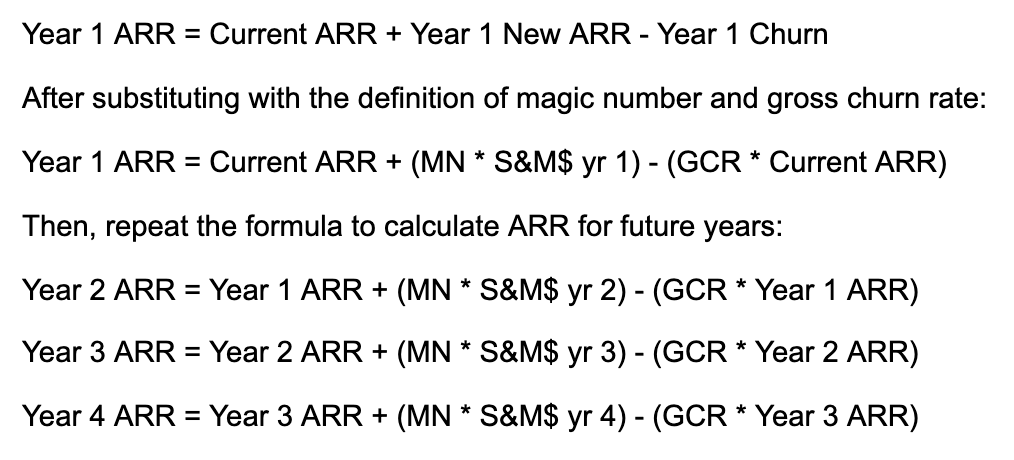
The simple spreadsheet model assumes that the gross churn rate (GCR) and magic number (MN) remain constant as the company grows (i.e. increases sales and marketing expenses). It is reasonable to assume a constant gross churn. However, the magic number normally declines as the company ramps sales and marketing expenses. In this case, the only variable becomes the company’s future investments in sales and marketing.
Scenario: When Does Growth Stop?
The simple financial model can predict when the company will stop growing by looking at just the gross churn rate to magic number ratio.
Referring back to the diagram in the previous section, growth stops when the green and red columns are equal. That is, when churn equals new ARR, and Net New ARR is equal to zero.
With this in mind, we can calculate the minimum amount of S&M$ that a company has to spend to be flat. A company will stop growing if the gross churn equals the new ARR generated by spending S&M$. That means a company stops growing if:
(Gross Churn Rate)/(Magic Number) > (S&M Expenses)/(Prior ARR)
The table below shows different levels of Min S&M$ required to keep growing. A higher Minimum S&M corresponds to a higher resistance to growth. Startup 1 needs to spend 30% of prior ARR to keep growing, while Startup 6 only needs to spend 5%!
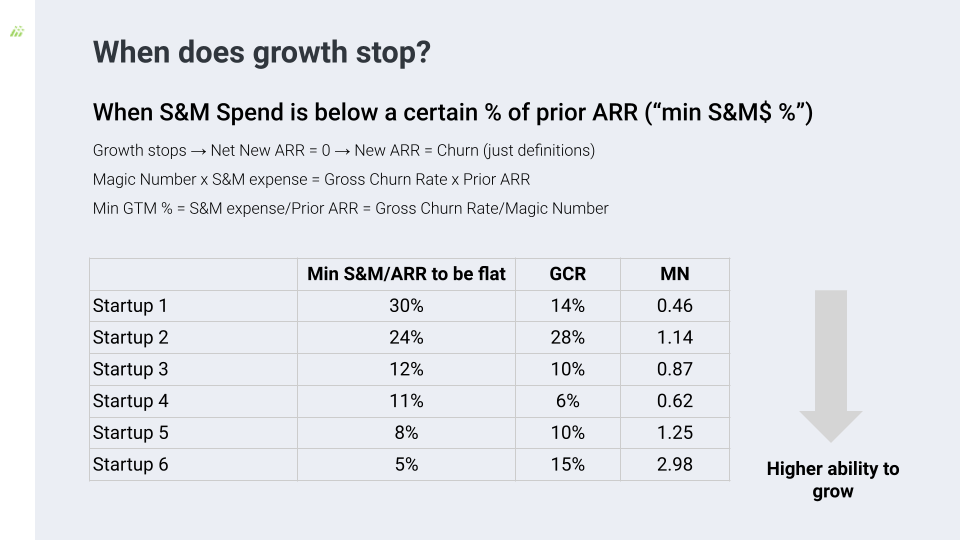
For a company with a GCR of 40% and MN of 0.4, the company would have to spend more than 100% of its prior ARR on sales and marketing in order to grow. That level of S&M$ spend is impossible to maintain for a no-growth SaaS company, since the company will be burning cash from its non-S&M expenses (e.g. R&D, G&A and COGS).
The math is explained below:
GCR x Prior ARR > Magic Number x S&M $.
Or, GCR/MN > S&M$/Prior ARR.
Scenario: Should You Invest More in Sales and Marketing?
If the LTV:CAC is above three, the answer to this question is yes. The graphic below shows examples of startups with different LTV:CAC ratios. Startup 1 has an LTV:CAC of 18.68, which means it’s way underspending on S&M.
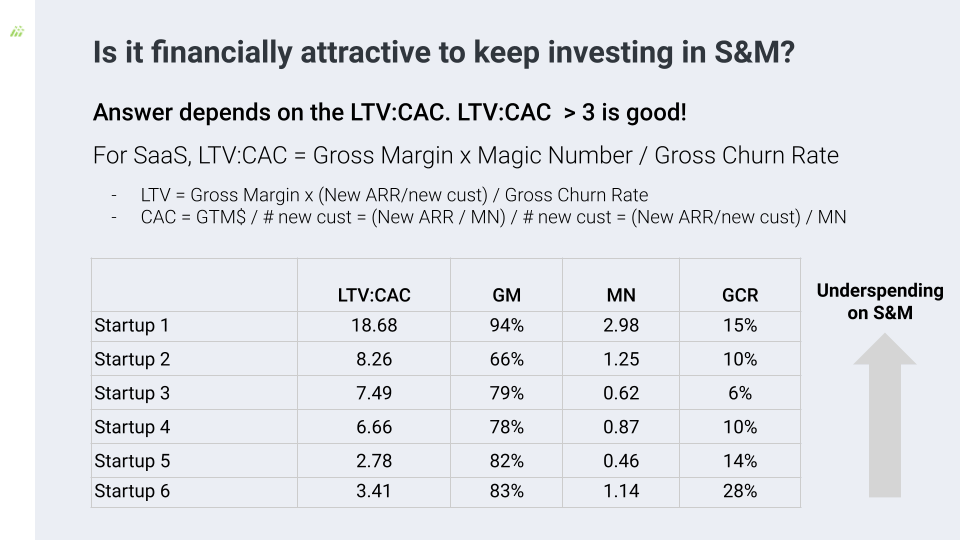
Forecast Cash Flow with Magic Number, Gross Churn Rate, and Gross Margin
After forecasting growth, investors can easily forecast cash burn. With some simplifying assumptions (1 year Total Contract Value, annual deals paid up front, 0 DSO’s, pay in 0 days), cash in and cash out become:
Cash In = Renewal + New ARR = Current ARR
Cash Out = COGS + Operating Expenses = Current ARR * (1-GM) + GTM$ + nonGTM$
Since Cash Burn = Cash In – Cash Out, Cash Burn = Current ARR * GM – GTM$ – nonGTM$
Then, repeat the formula to forecast cash flow for future years:
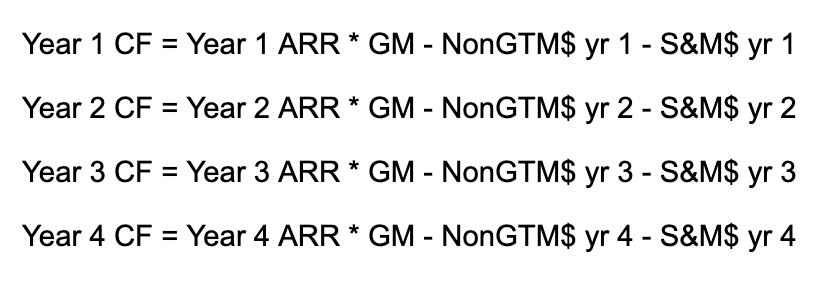
Scenario: Path to Cash Flow Break Even and SaaS Leverage
This is the point we call “SaaS leverage,” because after achieving this point, the startup becomes a cash machine. We can visualize CFBE in this diagram:
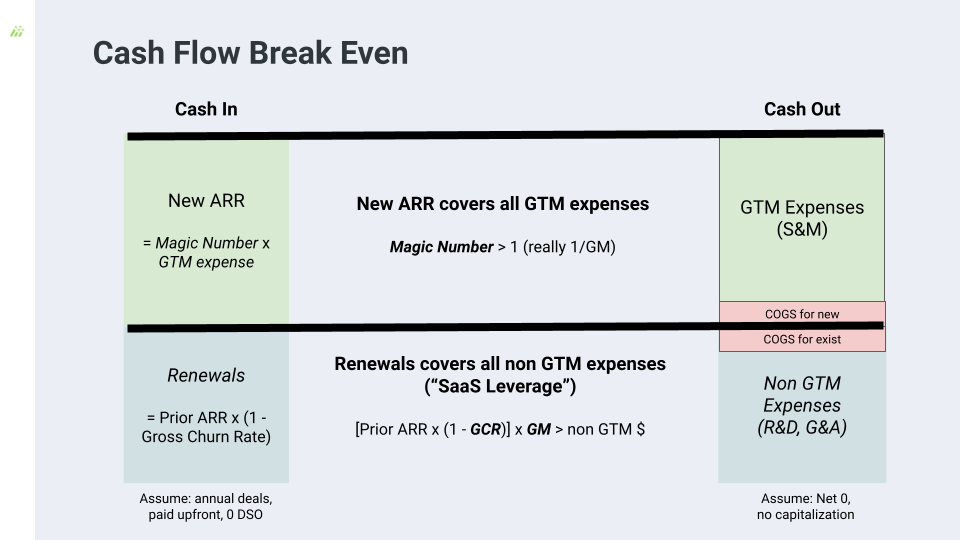
In this graphic, cash in (left) equals cash out (right). Cash in consists of New ARR plus renewals. Cash out equals GTM expenses (S&M$), non-GTM expenses (such as R&D, G&A), as well as cost of goods sold (COGS) for new and returning customers.
Now consider only the top row. If these boxes are equal, then New ARR covers all GTM expenses and COGS for new customers. In other words, the magic number is greater than or equal to 1. For every dollar of S&M$, the startup gets $1 or more of revenue out.
As for the bottom row, these boxes are equal if renewals cover all non-GTM expenses, i.e. renewals cover the cost of the startup’s existing business. This is the point of SaaS leverage.
But how do we get to this point?
The diagram below shows the situation of an early SaaS startup before CFBE.
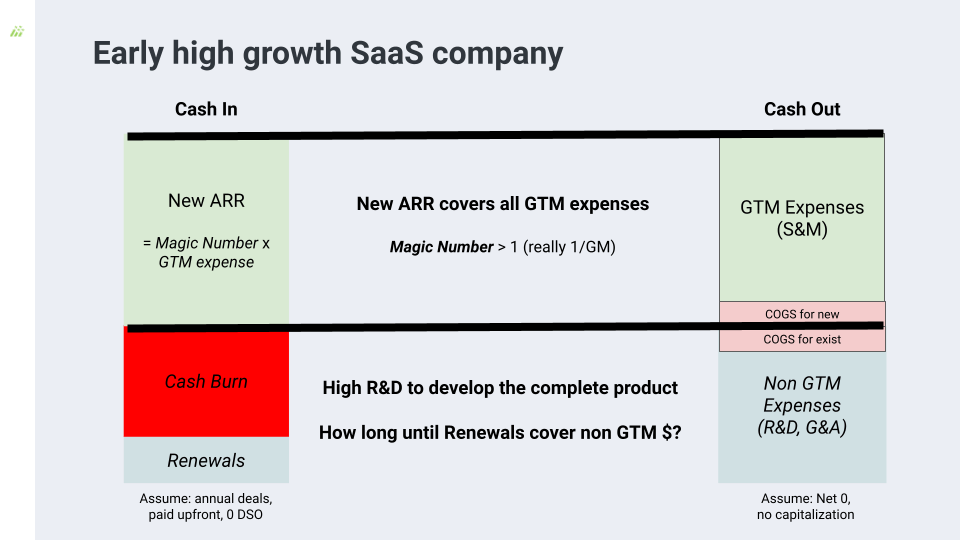
At this point, renewals are not yet enough to cover non-GTM expenses. This gap is shown in red: the company’s cash burn. The goal is to close that gap. The question is: how long until renewals cover non-GTM expenses? In the example below, the startup burned $10 million dollars for three years in a row. Will it keep losing $10 million/year forever?
Consider the diagram below. In January 2021, non-GTM spend (red) is greater than renewals (green). By using our Storm SaaS Data Model to forecast, we can determine the amount of S&M$ necessary (given our gross churn rate) to reach the target amount of ARR. In this case, the startup will achieve cash flow break even in eighteen months. After achieving this milestone, the company can easily glide to positive cash flow and financial independence by modulating its sales and marketing expenses.
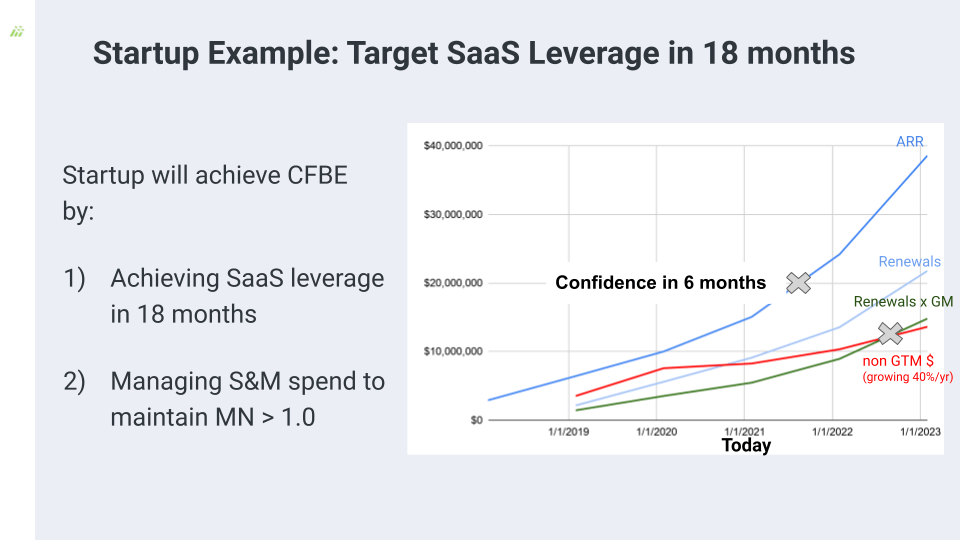
The point where the red and green lines cross is the point of SaaS leverage. After crossing this threshold, a SaaS startup becomes a cash machine!
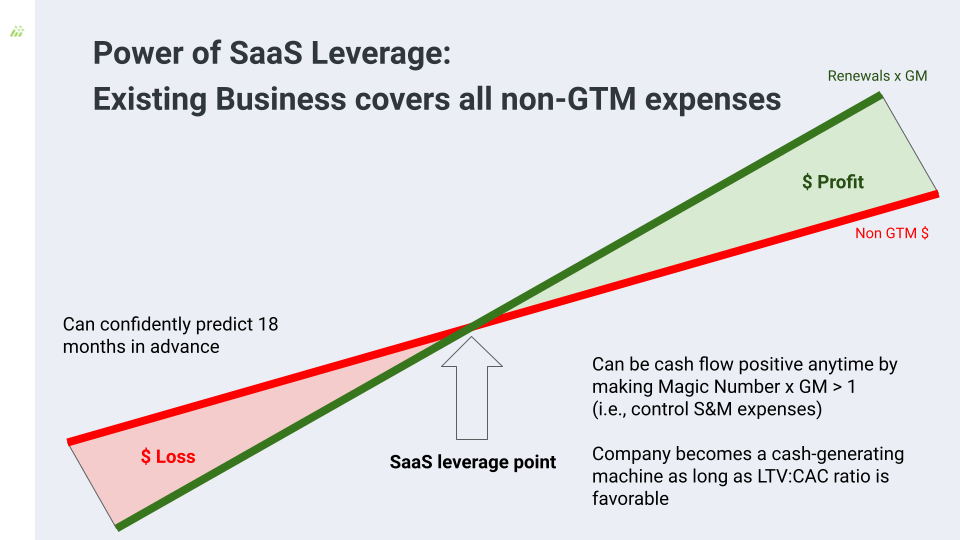
See below an example of a highly profitable startup. This startup’s renewals more than cover Non-GTM expenses. The profits (dark green) are impressive.
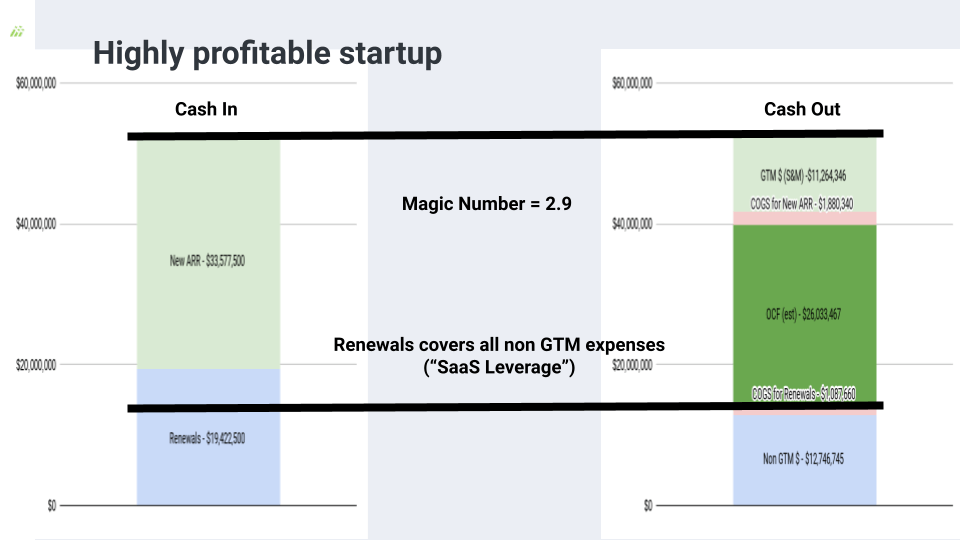
Next Round Valuation
Based on the forecasted growth and cash flow, what is the company’s expected valuation? In this section we’ll give the intuition for understanding how investors determine a company’s value.
Factors Impacting Valuation
Valuation depends on the vision, team, customers, technology, and scarcity. But valuation is also tied to financial metrics like revenues, cash flow, and growth rate combined with comparable valuation metrics (such as enterprise price/ARR).
It turns out that revenue growth rate is the primary factor. Barclays analyzed the top 20 SaaS companies on key financial and operational metrics including revenue growth rate, revenue size, gross margin, EBITDA margin, and rule of 40. The highest correlation is with revenue growth rate.
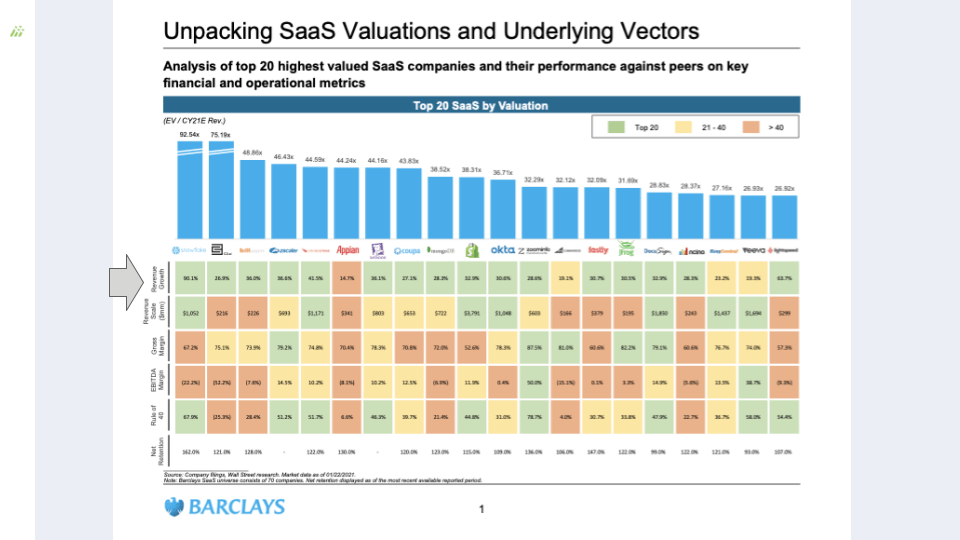
In fact, investors can determine the company’s valuation by simply multiplying the company’s revenues with the appropriate valuation/revenue multiple.
Understanding the Revenue Valuation Multiple
The SaaS valuation/revenue multiple is analogous to multiples for other kinds of investments. For example, take the real estate multiple: dollars per square foot ($/sqft). Given the size of a certain property in square feet, if an investor knows the average price of real estate in dollars per square feet, we can easily multiply these two together to estimate the value of the property.
Here’s an example for a 950 sqft apartment located in New York:
Apartment size: 950 sqft
Avg. $/sqft in New York: $1,000
Estimated value of apartment: 950 sqft x $1000/sqft = $950,000
Perhaps you’ve noticed by now the importance of another key variable: location. A 950 sqft apartment in New York will not be priced the same as a 950 sqft apartment in Tallahassee, where the average $/sqft is $112. The same apartment in Tallahassee would be worth $106,400 — only 11% of the price in New York! So the valuation of the apartment depends on two factors: size and location.
Valuing a SaaS company works exactly the same way. Instead of size in sqft, the SaaS valuation multiple uses ARR. And instead of physical location, the SaaS multiple depends on the company’s “neighborhood” of comparable companies (i.e., with similar growth rate and cash burn). The relevant valuation/revenue multiple is the average of the valuation/revenue multiple of comparable companies. To determine the company’s “neighborhood,” we typically group companies by their revenue growth rate.
Valuation multiple vs. revenue growth rate for public and private SaaS companies
Let’s consider the “neighborhood” of public SaaS companies. Below is typical public company valuation analysis, which has the revenue growth rate as the x-axis and revenue valuation multiple (Enterprise Value/ARR) as the y-axis. The line represents a linear fit of the valuation multiple and revenue growth rate. If you know your company’s revenue growth rate, you can find the corresponding multiple on the y-axis. Then, simply multiply by ARR to obtain an estimated valuation.
The x-axis stops at 50%, since public companies rarely grow above 50% per year.
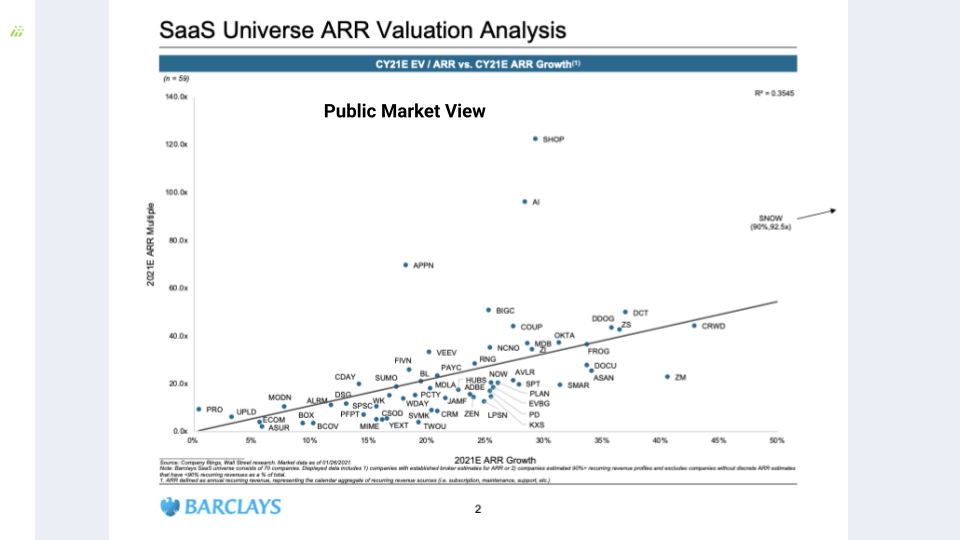
By contrast this is a comparable chart for venture capitalists. While public markets consider “high growth” as 20-40%, VC’s consider “high growth” 100-200%. Think about the real estate example again. New York real estate prices are growing, but probably not as fast (for now) as prices in Austin, TX, which saw a huge influx of population in the last few years. Venture capitalists are looking for the Austin equivalent of SaaS companies — those with high revenue growth.
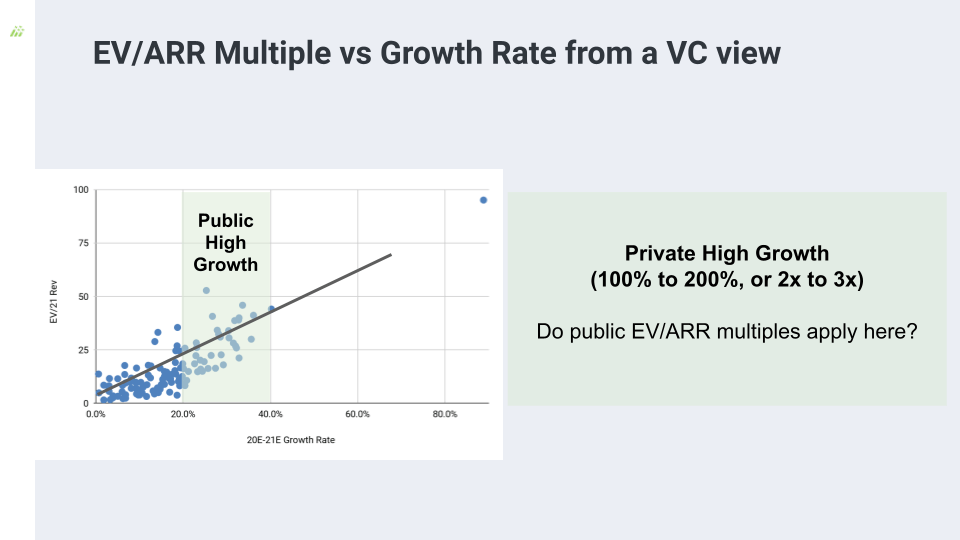
Finally, it’s important to understand that these multiples change over time. The chart below shows variation in high growth SaaS multiples over the years 2010 through 2020. Like real estate, SaaS companies are also subject to fluctuations in price even in the short run.
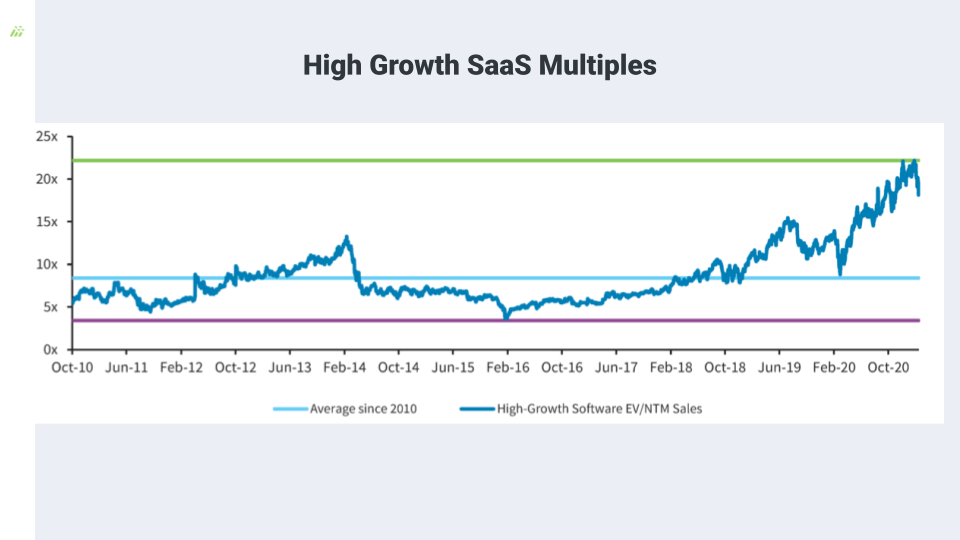
Spending and Operating Metrics
Thrival Dashboard
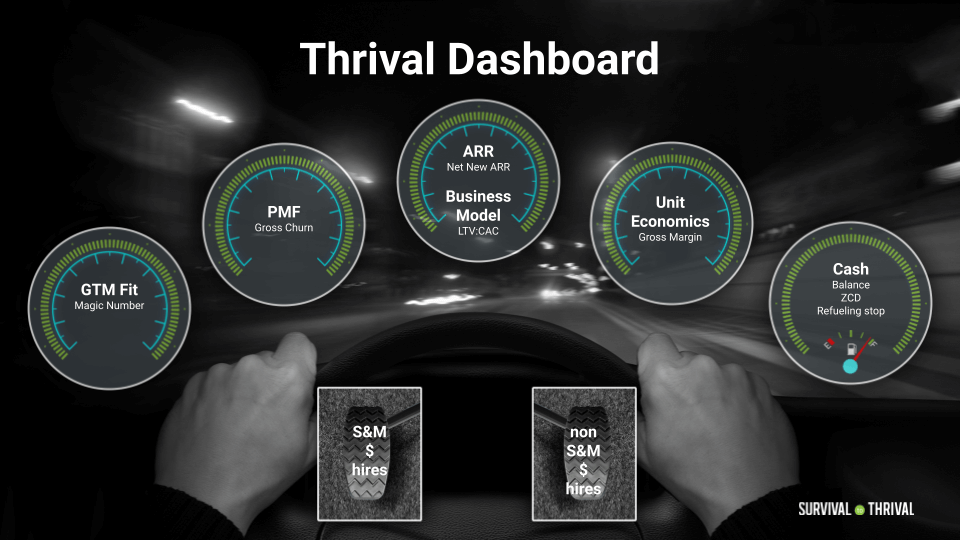
Think of these metrics as part of your Thrival Dashboard. Keep an eye on all of them to monitor how your business is going and decide which pedals to push — and when.
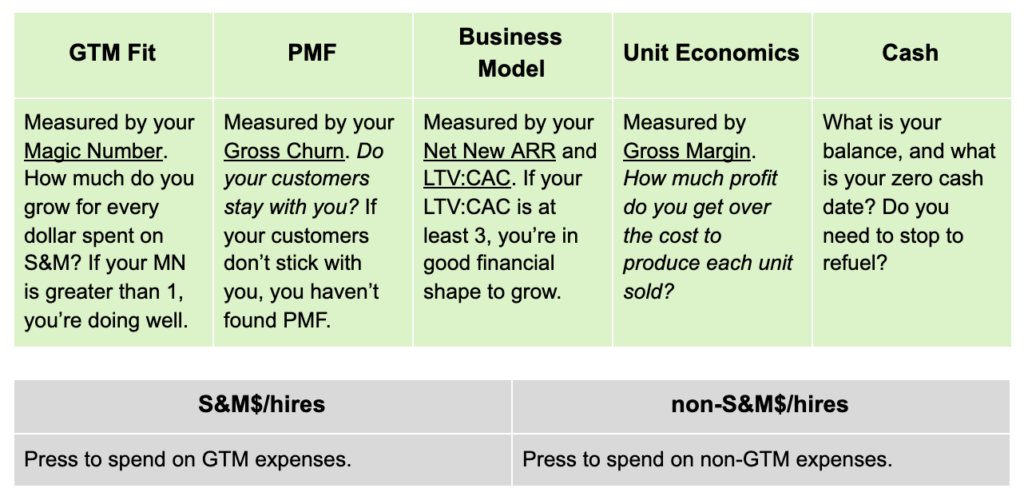
Improve the 3 Key Metrics
Given the importance of the three key metrics, the obvious question is how can I improve them?
Although the magic number and gross churn rate are very important financial metrics — especially in building the spreadsheet model — they are lagging indicators. For actually running the business, it is critical to find the leading indicators that will drive the magic number and gross churn rate.
Leading Indicator for Magic Number – Finding GTM Fit. If the company’s GTM requires sales reps, two key components for improving the magic number are:
- New pipeline creation: New pipe creation/sales rep. This ratio previews the company’s future sales and helps sales manage its capacity. As this ratio increases, the company should ramp its sales capacity.
New pipe creation is then further divided by the department driving its creation: marketing (inbound) + sales (outbound) + business development (partners). Allocating new pipeline creation to these functions creates more accountability, and thus better results. In our portfolio, one high growth SaaS company had 80% of its new pipeline generated by marketing, while another had 50% generated by partnerships.
Some might ask: what is the definition of new pipeline? I generally consider a deal new pipeline if sales starts spending time on the deal, but I don’t impose a standard definition across our portfolio. Instead, it is much more important to apply the new pipe definition consistently within that company over time. - Converting pipeline: New ARR/sales rep. This ratio measures the average sales rep’s productivity.
Related questions to understanding the sales rep’s productivity are:
– Quota. What percentage of reps made quota? What is average rep performance vs. quota?
– Sales Rep Economics. What is the fully burdened cost of the average sales rep? What is the profit contribution from each sales rep?
– Sales Capacity. What is the sales capacity? What is the new sales rep ramp?
Elasticity of the magic number. Usually, the magic number declines as a company ramps its sales and marketing expenses. Companies can easily game the magic number by reducing or limiting sales and marketing expenses, so it helps to plot the magic number alongside with S&M$ over time, as shown below:

Although the 2018 magic number is quite high, its value is questionable, and investors will wonder what might happen to the magic number once the company scales sales and marketing. In contrast, the 2019 magic number is very meaningful, because the company sustains (and actually improves) its magic number while scaling its sales and marketing expenses.
Leading Indicator For Gross Churn Rate – Finding Product-Market Fit. By analyzing the product usage data, customer service notes, and churn, companies can identify the leading indicators for churn. Customers achieving the right targets for usage and onboarding have low churn, while customers not achieving those targets have high churn.
Mark Roberge (former Hubspot CRO) shared three leading indicators for predicting churn in his YouTube video “The Science of Re-establishing Growth.”
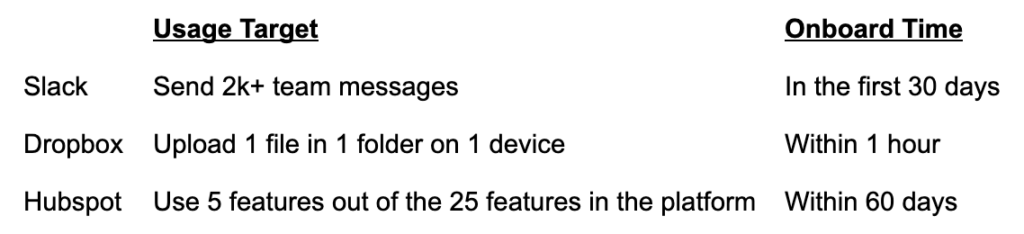
The right targets for usage and onboard time will focus the customer service and product teams to meet those targets, and thus reduce churn.
Cohort Analysis For Gross Churn (Or Gross Retention Rate). One common analysis of the gross churn rate is a cohort analysis, where each cohort consists of new customers acquired in a quarter.
Below is a sample cohort analysis for gross retention rate (GRR, which equals Renewals/Prior ARR or 1 – gross churn rate). Done more than 1 year after Q2 2019 in July 2020, this example shows the company significantly improving its GRR over time.
First, each new cohort of customers has a higher GRR, going from 73% to 95%. Second, the poor early cohorts saw a significant improvement in their second year retention (89% and 91%). In this example, the company may have improved its new customer onboarding, developed new features to make the product more compelling, or refined its ideal customer profile.
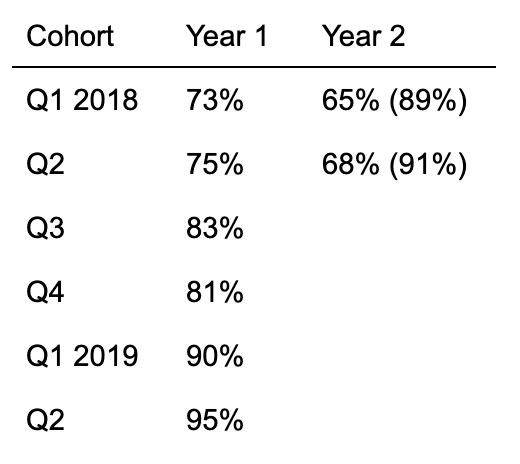
Cohort Analysis for Net Retention Rate. Related to the gross retention rate is the net retention rate (NRR). While GRR measures what percentage of the prior ARR has renewed, NRR measures how the existing customers’ business has grown or shrunk.
Net Retention Rate is calculated as (Renewals + Expands + Upsells)/Prior ARR. In contrast to the GRR, NRR excludes ARR from new customers, and thus the NRR forecasts growth even if the company acquires zero new customers. For example, a 139% NRR means the company will grow 39% even if the company acquires zero new customers.
Example 1. Investors do a similar cohort analysis for the net retention rate. The example below was made in Q2 2020, and thus the cohort data ends with Q1 2020. For the first customer cohort (those who first became customers in Q1 18), their business (total ARR) grew by 11% in the first quarter, then an additional 2% in the second quarter, then an additional 9% in the third quarter, and an additional 16% in the fourth quarter. So, the ARR from those customers grew by 38% in their first year. In comparison, the second cohort of customers (Q2 18) grew by only 27% in their first year.

Example 2. When evaluating companies, investors want New ARR broken down into its two components: New ARR = New ARR from new customers + New ARR from existing customers.
Below is an example of two companies claiming a 100% growth rate:
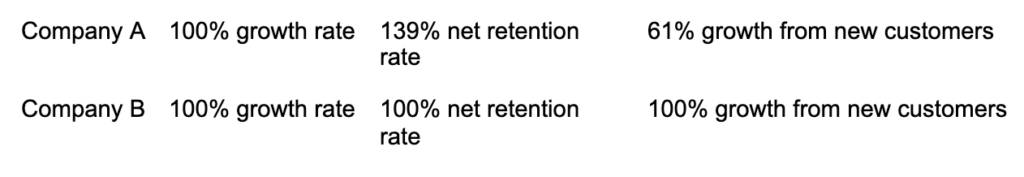
Since investors believe sales to new customers are harder than sales to existing customers, Company A has a more believable future growth rate.
Appendix: Build the Storm Financial Model

How do you know if you have a good Subscription-as-a-Service (SaaS) financial model? You probably get a set of finances from your accountant that shows if your business is profitable. But just knowing if you’re profitable doesn’t mean that you have a good financial model.
A good SaaS model helps answer key questions about the future of your business.
- Do you know if your growth will peak? How much cash do you need to achieve positive cash flow?
- Have you achieved product-market fit or go-to-market fit from a financial perspective?
- What is your LTV:CAC ratio?
A good SaaS model will also help the CEO make the appropriate investments.
- How much should you spend, and where should you spend it?
- Should you invest more or less in sales and marketing?
- Should you try to grow faster or slower?
- Would investors fund this plan?
To answer these questions, we build a Storm SaaS financial model with only three key metrics: Magic Number, Gross Churn Rate and Gross Margin. With this SaaS financial model, we can simulate different scenarios. By inputting different amounts of GTM and non-GTM spending, the model forecasts ARR, cash burn, and unit economics.
For a copy of the model, please email S2T@stormventures.com.
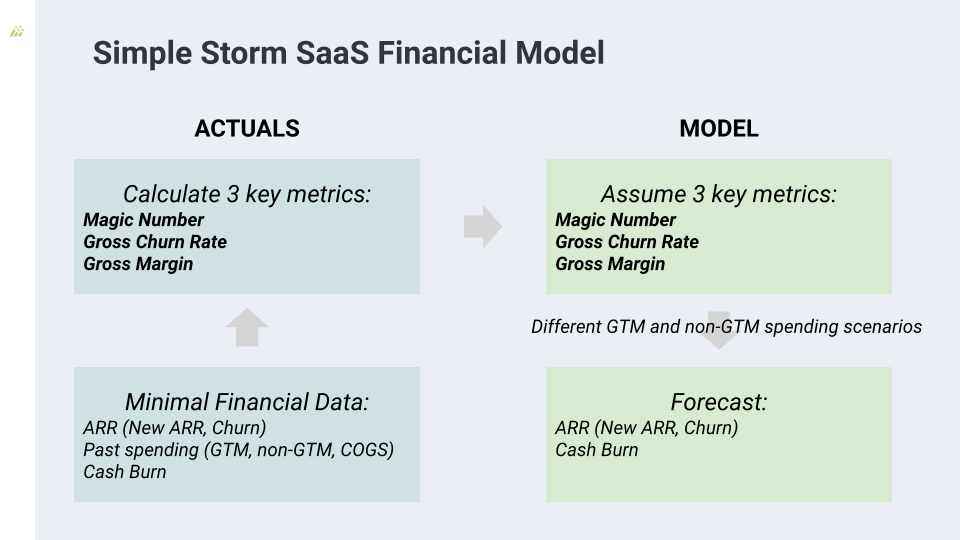
Derive the 3 Key Metrics
In order to calculate the 3 key metrics (gross churn, magic number, gross margin), the Storm SaaS model requires three types of data: ARR breakdown, Expense breakdown and Operating Cash Burn. In the Storm SaaS model spreadsheet, one just needs to fill in the light green shaded cells, and the spreadsheet will calculate the three metrics. (Open the spreadsheet and go to the “Data Required” tab to input the data.) The tables below illustrate the breakdown for ARR data and Expense data.
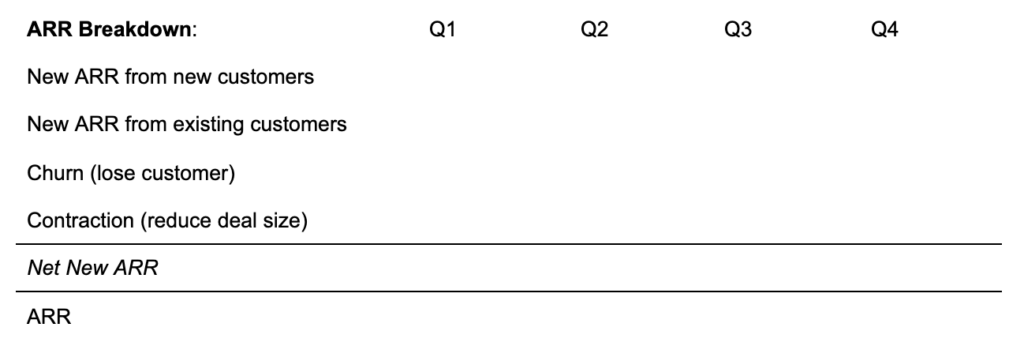
As the company matures, we may want to view the company’s business by customer segment, product, geography, channel, and sales leader.
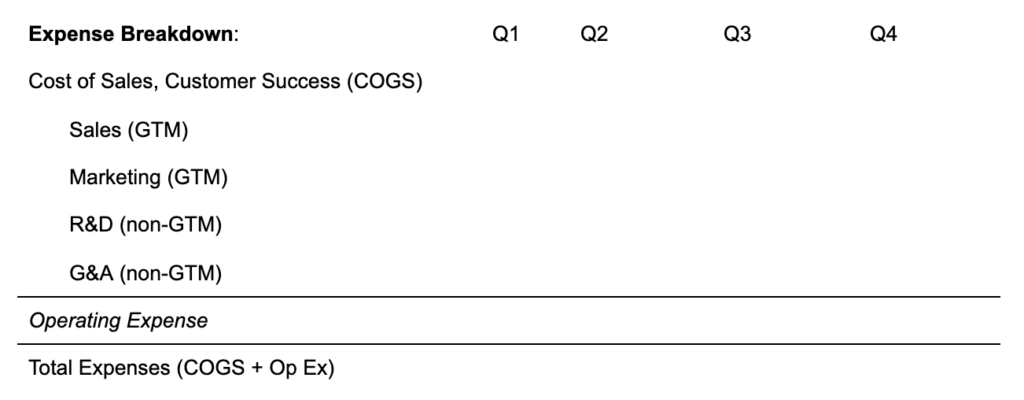
Once you’ve inputted the data and derived the key metrics, the spreadsheet will allows you to forecast growth, cash flow, next round valuation, and more.
After building the Storm SaaS financial model with the three key metrics, we can model different scenarios.